Row Zero makes it easy to find, highlight, count, and/or remove duplicates in a big spreadsheet. It's just as easy to find, highlight, and count unique values in a sheet. Since Row Zero is 1000x more powerful than traditional spreadsheets, you can easily work with files too big for Excel or Google Sheets. You can also connect directly to your data sources to build auto-updating spreadsheets that dynamically count and highlight duplicates and uniques as your data changes.
Skip to a section below or continue reading for the full guide
- Find, highlight and remove duplicates
- Find, highlight and count unique values
- Dynamically count and highlight dupes and uniques
- Distinct vs unique values
Remove Duplicates in a big spreadsheet
Row Zero makes it easy to remove duplicate values in a big spreadsheet with a built-in feature that works like remove duplicates in Excel and Google Sheets. Here's a remove duplicates tutorial:
How to remove duplicates in your spreadsheet:
- Open up a Row Zero workbook and get your data ready. You can import a file via Data in the navigation, or click Connections to sync data from your data source.
- Select the range of cells you would like to remove duplicates from. If you don't select a range of cells, it will select the entire sheet by default, which is generally recommended.
- There are two ways to access the feature:
- In the header menu, go to Data, Remove duplicates
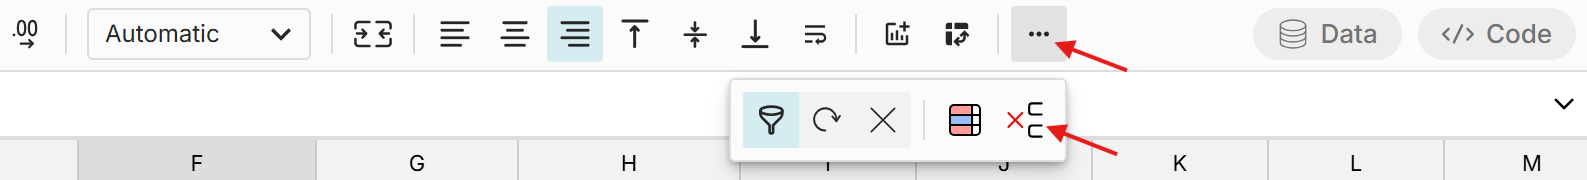
- Click the remove duplicates icon in the formatting menu in the header.
- Select the column(s) that you want to remove duplicates from. If you select multiple columns, it will only remove duplicate rows that have duplicate values in each of the columns selected. Note that all columns are selected by default, but in many instances you may want to select just one or two columns.

- Click Apply and all matching duplicate rows will be deleted from the sheet
Row Zero is 1000x more powerful than traditional spreadsheets so you can easily remove duplicates in big CSV files. Row Zero also supports a variety of large file formats, so you can easily remove duplicates in parquet, JSONL, TXT, .gz, etc. in addition to deduping CSV files.
Highlight duplicates with conditional formatting
If you want to find and highlight duplicate values but not remove them, you can use Row Zero's conditional formatting feature to set the Condition to Duplicate. This will find duplicate values in the range and apply your desired formatting to highlight duplicates in your sheet. Here's how to conditional format duplicates in your sheet: 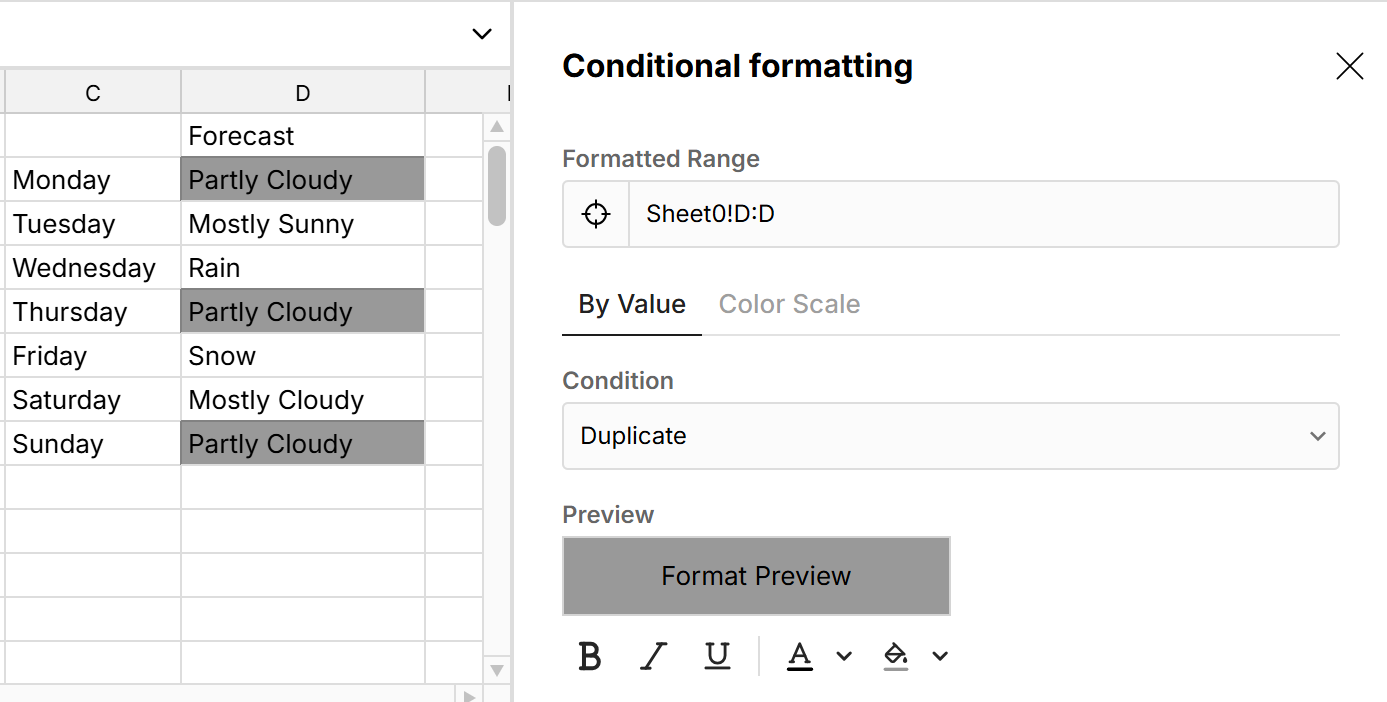
Highlight duplicates in multiple columns
You can also use conditional formatting to highlight duplicates across multiple columns. Simply select multiple columns for your range and set your condition to Duplicate 
This will show duplicate values across multiple columns and within the same column.
Search and Find Duplicates
If you want to find duplicates of a specific repeating value, you use the CTR + F shortcut to find duplicates of the same value or use the Filter feature. These can be useful if you want to find every instance of one value and then edit or delete just those values.
Filter Duplicates and Count Duplicates with COUNTIF
You can use the COUNTIF function to count duplicate values in a column and then filter on Count = 1 (or select 1 in the dropdown) to filter out duplicate values or filter to Count > 1 to filter to duplicate values only. Here's how:
- In a new column, write a COUNTIF formula that uses the column you want to filter as the criteria range, and then a specific cell in the column as the criteria.
- Hit enter and this formula will count the number of times a given value exists in the given range.

- Drag the formula down the column
- You can then filter this new column to 1 to filter out duplicates and only show unique values
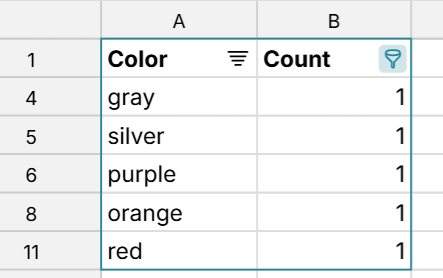
- Similarly, you can filter to duplicates by filtering to >1 to show duplicates only (non-unique values)

- You can also apply a sort on the Count column to sort by duplicate count.
You can follow these same steps using COUNTIFS to filter duplicates or find uniques based on multiple criteria.
Find, highlight and count unique values in a sheet
In addition to deduping your file by removing duplicates, you can use multiple techniques to highlight and count unique values in your spreadsheet. Pivot tables are a powerful feature for drilling down to unique values and counting unique values, but you can also use several formulas and conditional formatting to highlight uniques and count distinct values.
Pivot tables to view and count uniques
Pivot table to count values - You can easily drill down to unique values with a pivot table. To create a pivot table, select your data range and go to Insert, Pivot table and move the field you want to see unique values for to Rows and then summarize data by these values by moving fields to Values. The simplest way to count uniques is to pull the same field to Values as Rows and select Count as the calculation to apply.
 This will give you a row for each distinct value and count the number of times each distinct value shows in the data.
Pivot table to count UNIQUE values - Row Zero pivot tables have a built-in Count Unique calculation that counts the number of unique values in a given column or field.
Count Unique in a pivot table can be very useful for things like counting the number of unique user IDs that have performed a particular action over a period of time (e.g. unique logins by week). Here is a live example pivot table count unique so you can see exactly how it works.
Pivot table count unique with multiple criteria - You can use Filters when creating a pivot table to count unique values using multiple criteria
 After creating a pivot table, you can also use filters within the pivot table to apply multiple filters to further narrow your data.
Formulas to show and count unique values
There are a few options for showing and counting unique values using formulas:
- UNIQUE function creates a list of unique values from a specified range
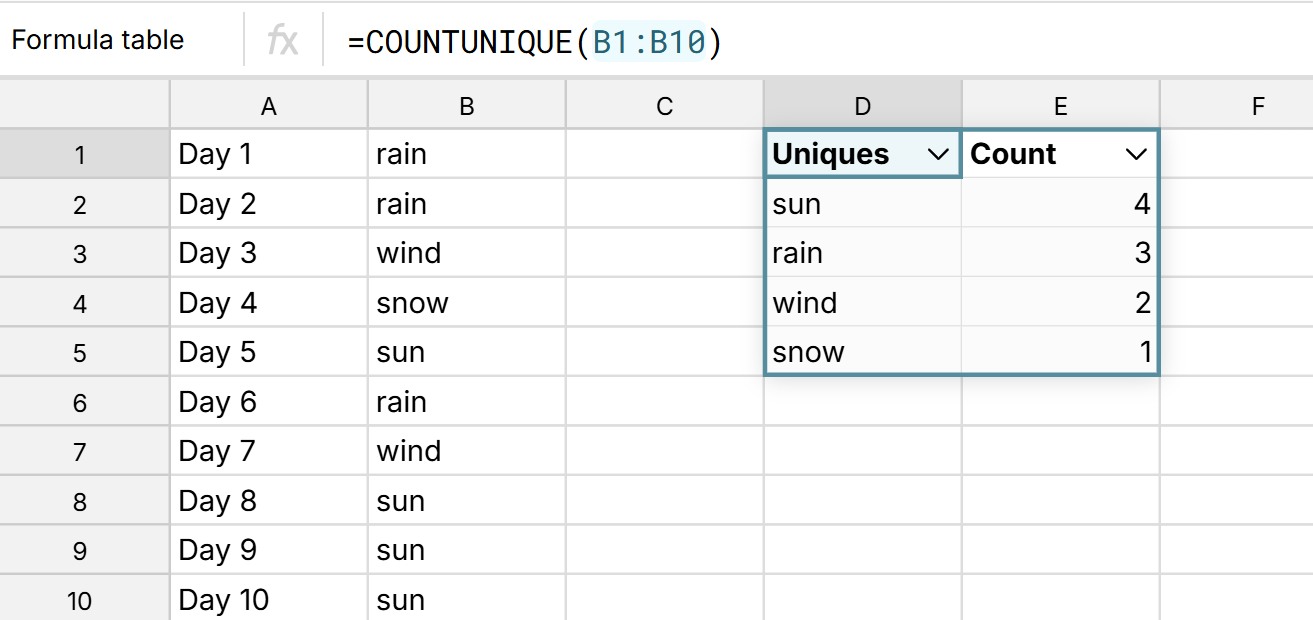
- COUNTUNIQUE function creates a data table with a row for each unique value and a count of how many times the value appears in the range. This effectively a quick pivot and count.
- COUNTIFS function can be used to count the number of times a unique value appears in a range, which can then be filtered to show unique, non-repeating values.
Highlight uniques with conditional formatting
Similar to conditional formatting duplicates, you can also use conditional formatting to highlight unique values that only appear once in a range by setting the Condition to Unique. Here's how to conditional format unique values: 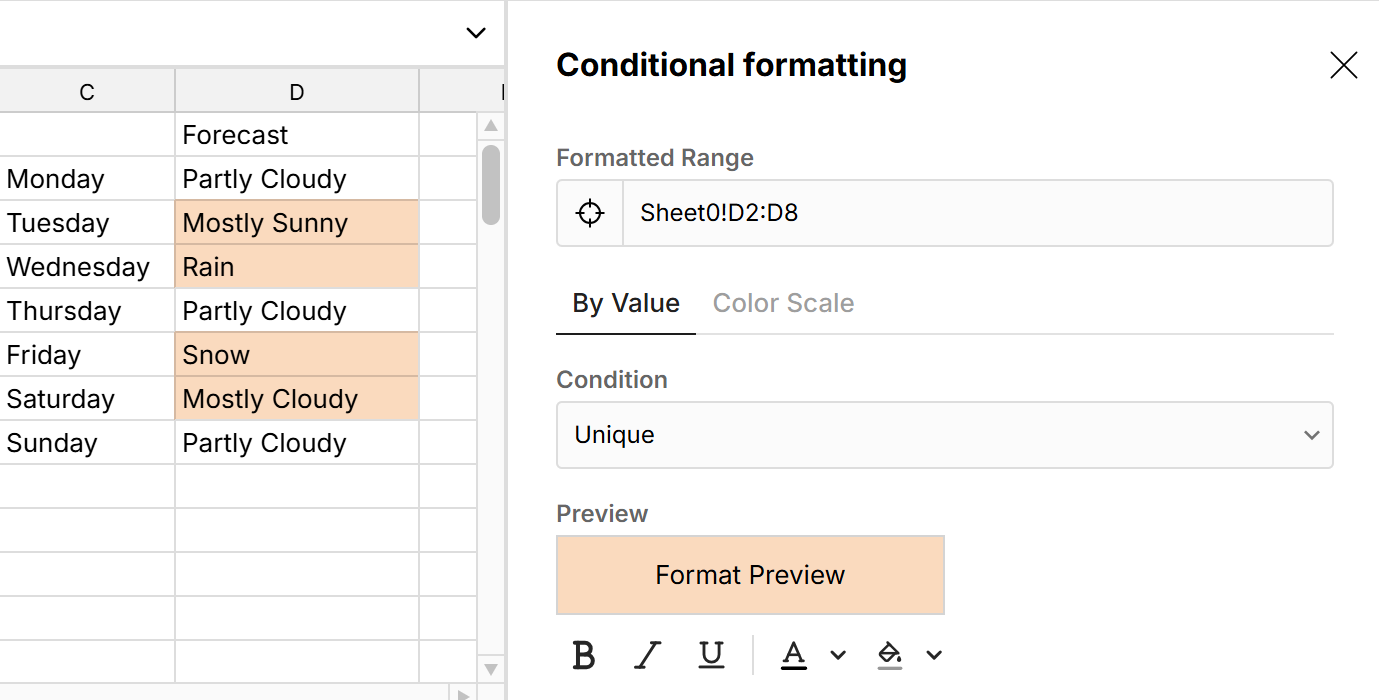
Dynamically count and highlight duplicates and uniques
Row Zero makes it easy to connect your spreadsheet directly to your database or data warehouse to build auto-updating dynamic spreadsheets. Everything built on connected data dynamically updates and stays in sync. So you can easily build dynamic pivot tables to count uniques and highlight duplicates, as well as dynamic COUNTIFS to dynamically filter to duplicates or uniques, and dynamic conditional formatting to highlight duplicates automatically as new data comes in.
Distinct vs unique values
You may see spreadsheet features referring to distinct values and unique values and these are often used interchangeably. However, there can be a key difference between distinct values and unique values. Distinct values refers to the total number of distinct values in a range. Repeating values count as 1 and unique values count as 1. Unique values can mean totally unique, non-duplicating values that show up once and only once. In this case, repeating values are excluded and count at 0, whereas non-repeating values that only show up once in the range are included. Here's a breakdown of how this works in Row Zero:
- Pivot tables - looks at distinct values when you drag a field to Rows or Columns. Every value is included once and only once.
- Pivot table Count Unique - Counts distinct values (every value is counted once, even if some repeat)
- Conditional formatting uniques - highlights totally unique non-repeating values only. If a value appears more than once, it is not highlighted.
- UNIQUE function - creates a list of all distinct values in a range
- COUNTUNIQUE function - creates a table of all distinct values along with a count of the number of times they show in a range.
- COUNT, COUNTIFS, etc - count the total number of values that match the criteria. You can then apply filters to show any of unique, distinct, or duplicating values.
Showing and counting unique values in Google Sheets and Excel is similar to Row Zero. Excel pivot tables Count Distinct (when you add the data to the Data Model) feature is effectively the same as Count Unique in pivot tables in Google Sheets and Row Zero.
Conclusion
Row Zero makes it easy to find, highlight, count, and remove duplicates in a big spreadsheet. You can similarly filter, highlight, and count unique values in your sheet. There are multiple built-in features to help you including remove duplicates, pivot tables, conditional formatting, and formula functions. These are similar to count uniques and remove duplicates in Excel and Google Sheets, but offer some distinct advantages. Row Zero makes it easy to work with large datasets and connect to data sources to build dynamic pivot tables, formulas, and conditional formatting to create auto-updating analysis that counts and shows duplicates and uniques as your data changes. Row Zero works like Excel and Google Sheets and is free to try.