A dynamic pivot table updates automatically when new data is added or when existing data changes. Dynamic pivot tables are often connected to a live data source and are especially useful for analyzing large datasets that frequently change. It can be a challenge to create a dynamic pivot table in Excel or Google Sheets with big datasets. These pivot tables will crash if your data expands beyond Excel’s 1 million row limit or Google Sheet’s 10 million cell limit. Row Zero pivot tables are dynamic pivot tables by default and are the best pivot tables for big data users who actively work with pivot tables.
In this pivot table guide, we’ll show you how to create a dynamic pivot table in Excel, Google Sheets, and Row Zero and show why Row Zero is the best spreadsheet for big data. Skip to a specific section below or keep reading for the full guide.
- Best Dynamic Pivot Tables: Row Zero
- Create a dynamic pivot table connected live to your data source: Row Zero
- Create a dynamic pivot table from cells: Row Zero
- Dynamic pivot tables in Excel
- Dynamic pivot tables in Google Sheets
- Conclusion
Best Dynamic Pivot Tables: Row Zero
Row Zero is a next-gen spreadsheet built for big data and enterprise security. Row Zero pivot tables are truly dynamic pivot tables. They're dynamic by default and are easy to create and work with.
Row Zero pivot tables are dynamic in four ways:
- Dynamic with source data
- Dynamic within the pivot table
- Dynamic with output: Build on top of your pivot table
- Dynamic with data size
1 - Dynamic with source data
Row Zero pivot tables dynamically update with source data. This works in a few ways:
Connected to data warehouse/data source
When you connect directly to your data source (e.g Snowflake) your pivot table will update every time you run your SQL query. You can also schedule data refresh to automatically update your pivot table as your source data updates.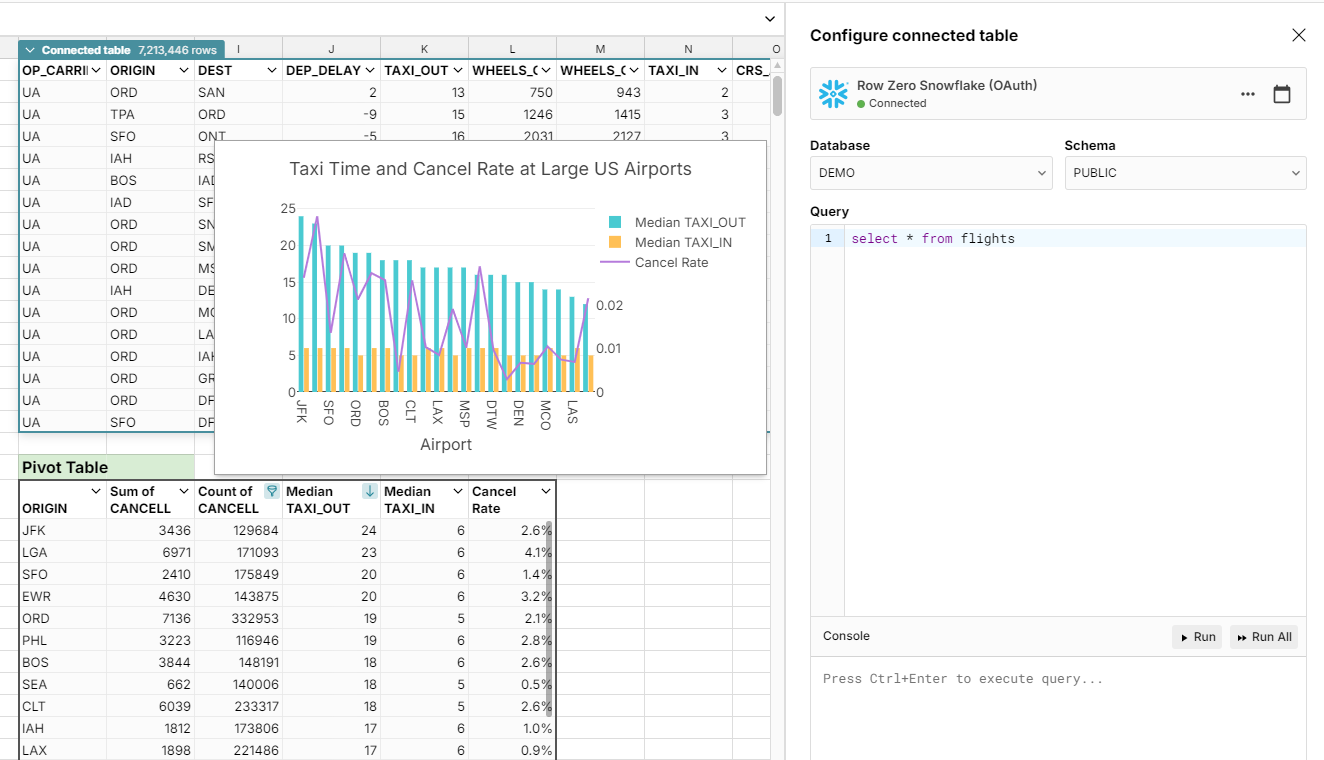
Pivot table on cell ranges
If you create your pivot table based on cell ranges, you can do a wide range of transformations on your source data and your pivot table automatically updates when the source data range changes. You can insert or delete rows and modify cells in your source data range and your pivot table updates automatically in real-time, even when the data range expands or shrinks. You can also manually change the pivot table source or update the pivot table range in the pivot table editor.
2 - Dynamic within the pivot table
Pivot tables are read-only so data contained within cannot be edited or overwritten. However, Row Zero makes your pivot tables dynamic and easy to work with:
- Easy to edit and update: You can easily edit pivot table rows, columns, values, filters, and calculations by double clicking any cell in the pivot table. This lets you quickly preview the data and make adjustments.
- Pivot and filter: You can easily filter pivot tables based on cell values in any column or filter multiple columns in your pivot table. You can filter pivot tables by values, filter by date, filter by category, etc.
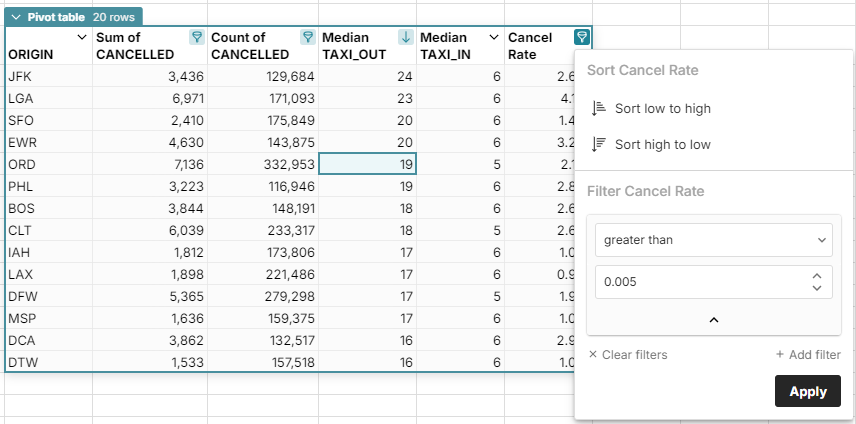
- Pivot and sort: You can easily sort pivot tables by any column or sort mulitple columns. You can sort pivot tables by values, sort by dates, sort largest to smallest, etc.
- Easy to format: Format pivot tables just like any other cells. Easily format pivot table dates, numbering, font, text size, colors, etc.
- Hide columns: While you cannot delete columns you can hide columns in pivot tables.
- Easy to move: Move pivot tables easily by dragging or cut/paste.
- Duplicate pivot tables: Easily cut, copy, and paste pivot tables in the same sheet or a different sheet.
3 - Dynamic with output - build on top of your pivot table
When your pivot table updates, everything referencing it updates as well. This lets you easily build on top of your pivot table using your pivot table as your source data.
Add calculated columns to pivot tables:
Easily add calculated fields to your pivot table. Create column level transformations by simply typing a formula in the column next to the pivot table and referencing a named column in the pivot table. This prevents you from having to fill a function down which is especailly helpful for large datasets of millions of rows. 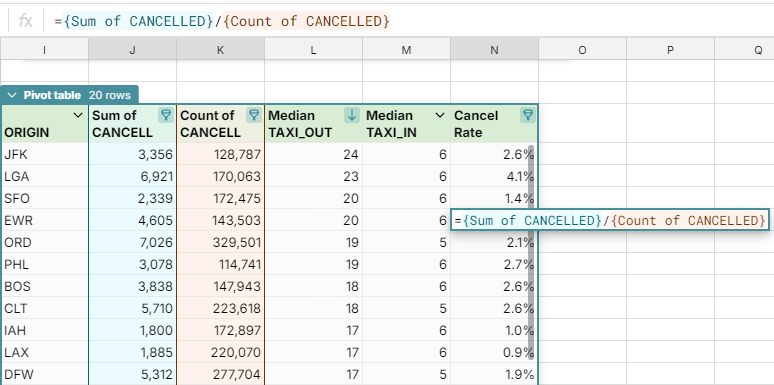 Build formulas on pivot table data:
You can use a wide range of Excel-compatible forumlas on pivot table data. Here are some popular ones:
- XLOOKUP and VLOOKUP pivot table data - You can use LOOKUP formulas to reference and look up data in pivot tables. XLOOKUP is recommended for its versatility of choosing any column as the lookup range, especially if you edit column order.
- COUNTIF and SUMIF pivot table data - You can slice pivot table data further with any of the logical IF formulas like SUMIF, AVERAGEIF, and COUNTIF on pivot tables in Row Zero.
Create pivot charts:
Easily create dynamic charts from your pivot table that automatically update as you edit and filter your pivot table. These charts auto update as source data changes. 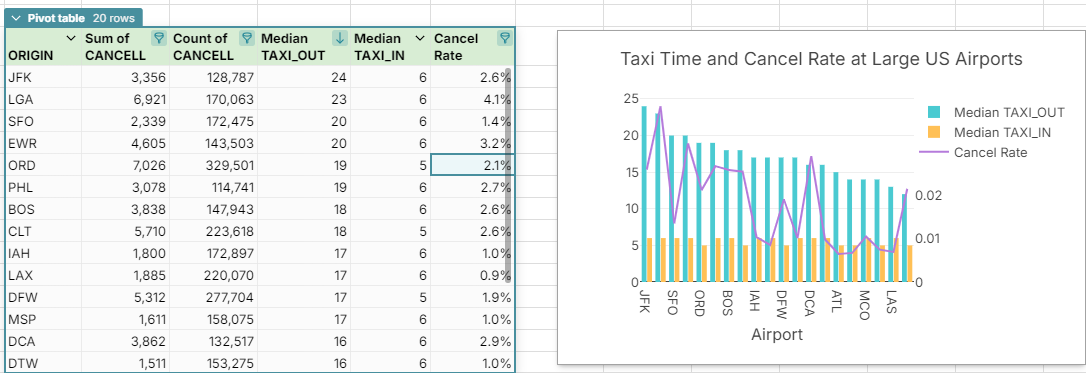
Pivot a pivot table:
Easily create pivot tables from pivot tables. 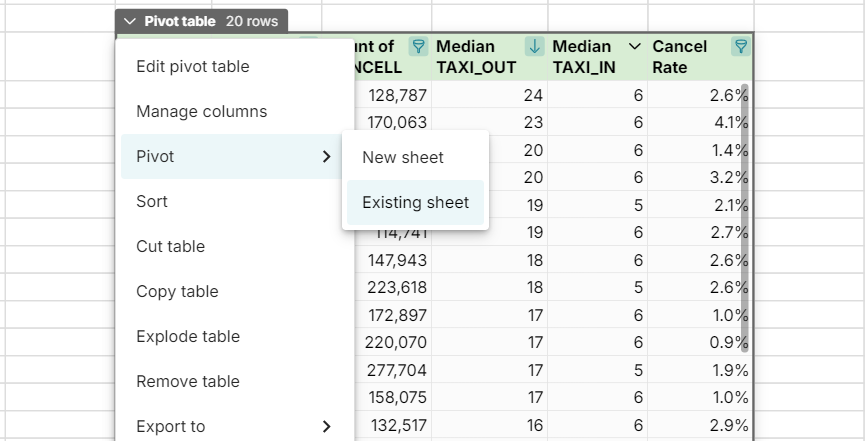
Writeback to your data warehouse:
Row Zero lets you export pivot tables to your data warehouse where they can then be pulled anywhere. Users sometimes use this as a hack to pivot Snowflake tables or clean up data before importing to Snowflake (and other data warehouses). 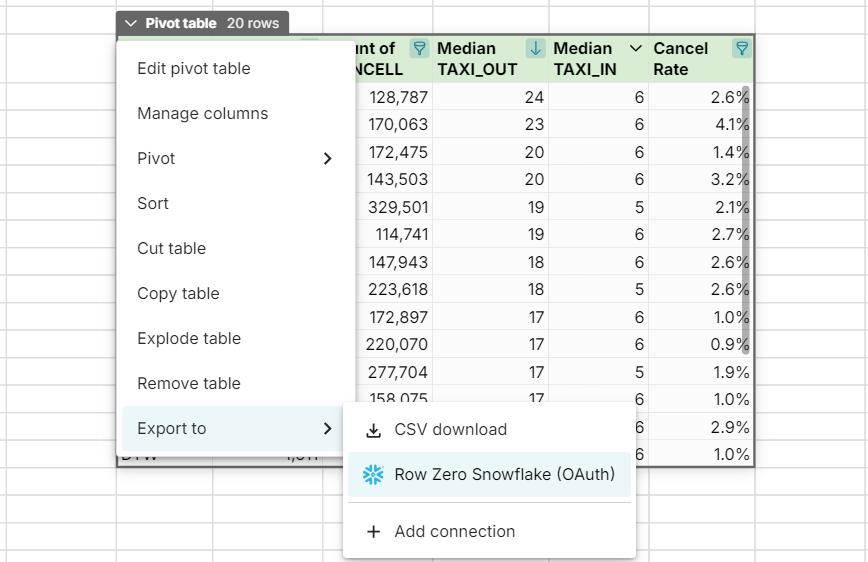
4 - Dynamic with data size
Row Zero is built for big data and can handle billion row spreadsheets, which is 1000x larger than Excel's limit of 1,048,576 rows. Google Sheets has a similar limit of 10 million cells. Row Zero's massive data capabiliites offer multiple unique advantages:
- Build big data pivot tables in a spreadsheet, letting users of all technical levels quickly analyze large datasets.
- Easily connect to data sources and pull in entire database tables with SQL pivot tables in your spreadsheet.
- Pivot multiple massive datasets in the same spreadsheet
- Cascade pivot tables, creating pivot tables from pivot tables from pivot tables.
- Create a dashboard of pivot tables and pivot charts with multiple pivot tables in one sheet and view.
While dynamic pivot tables may seem complicated, they are super simple with Row Zero and easy for any spreadsheet user. The large amount of dynamic features above simply represents how versatile these pivot tables are. Ready to get started?
Try Dynamic Pivot Tables in Row Zero
How to create a dynamic pivot table connected live to your data source: Row Zero
Open up a workbook in Row Zero:
Login or sign up for free to get startedConnect to your data source
To create a truly dynamic pivot table, you'll want to connect directly to your data source. Click "Connections" in the top right to connect directly to your data source (Postgres, Snowflake, Databricks, Redshift, BigQuery, etc).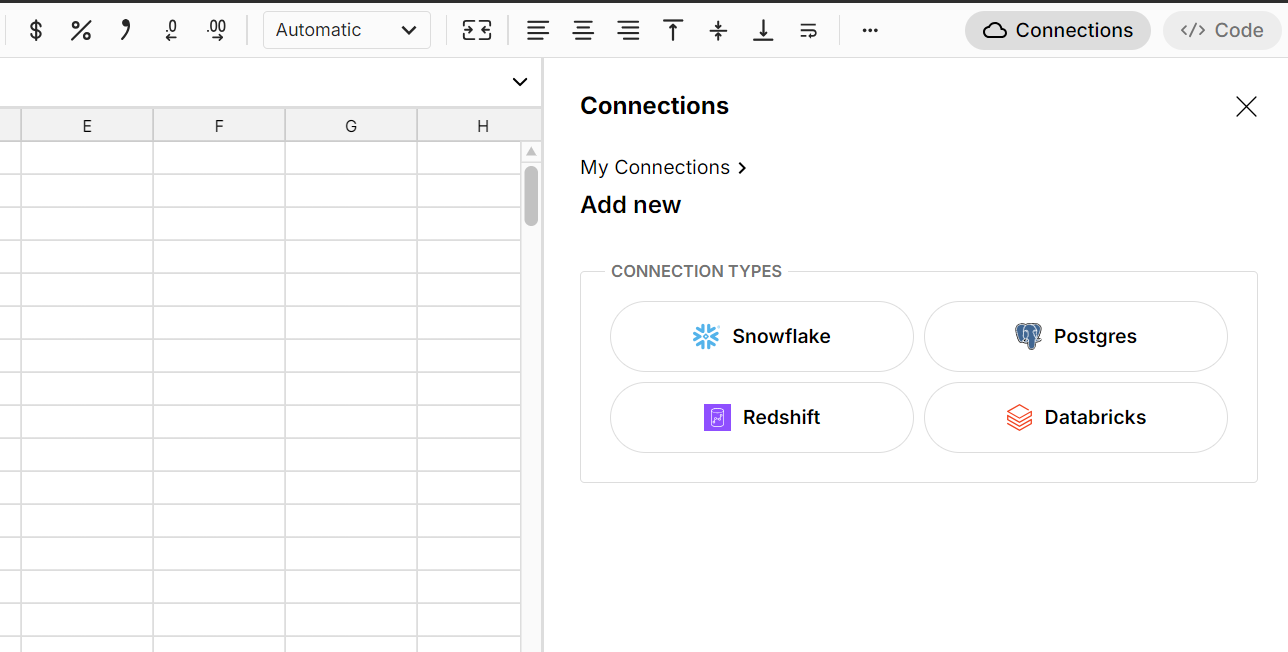
Select * from whatever table(s) you want
Row Zero is large enough to pull in entire database tables in most situations, so you can write a SQL statement as simple as "Select * from your_table_name", or if you prefer, you can write a SQL statement to pull a subset or to join multiple tables and click "Run".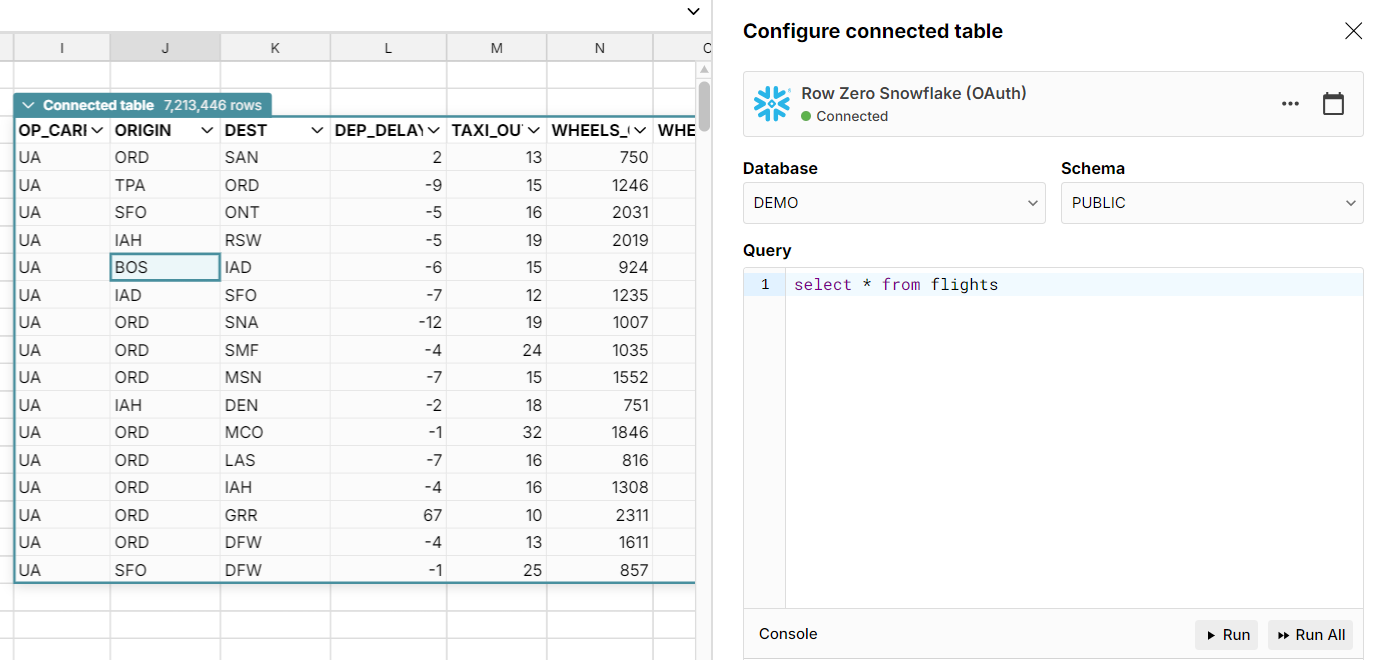
A Connected Table is generated in Row Zero
This creates a connected table, which is a live connection to your data source that dynamically updates as your source data updates.Click create Pivot Table
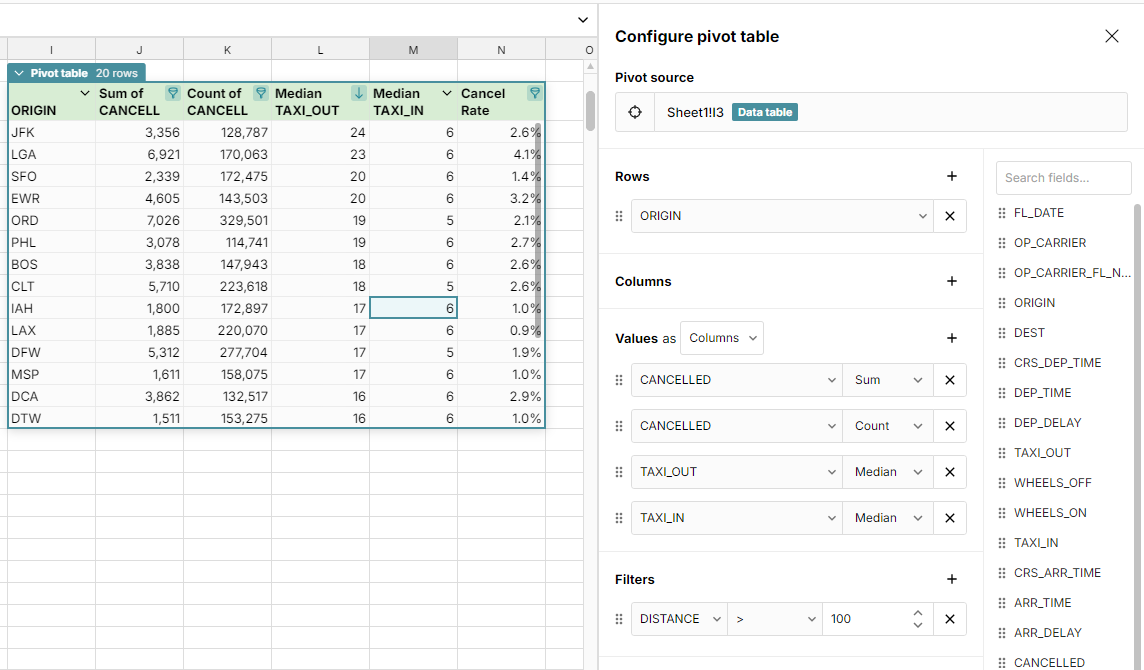
Click the dropdown header for your connected table and select Pivot. Choose new sheet or existing sheet and then select your pivot table values in the pivot table editor.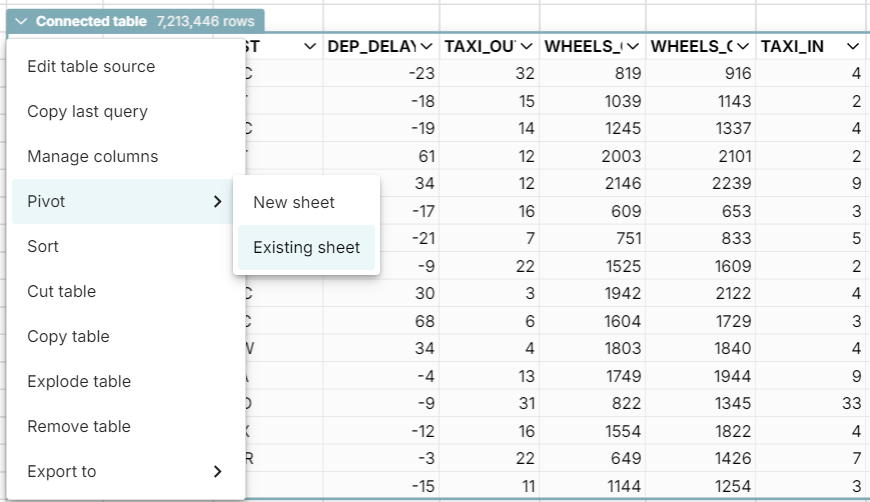
Result: A live pivot table directly connected to your data source
You've created a dynamic pivot table that is directly connected to your data source. 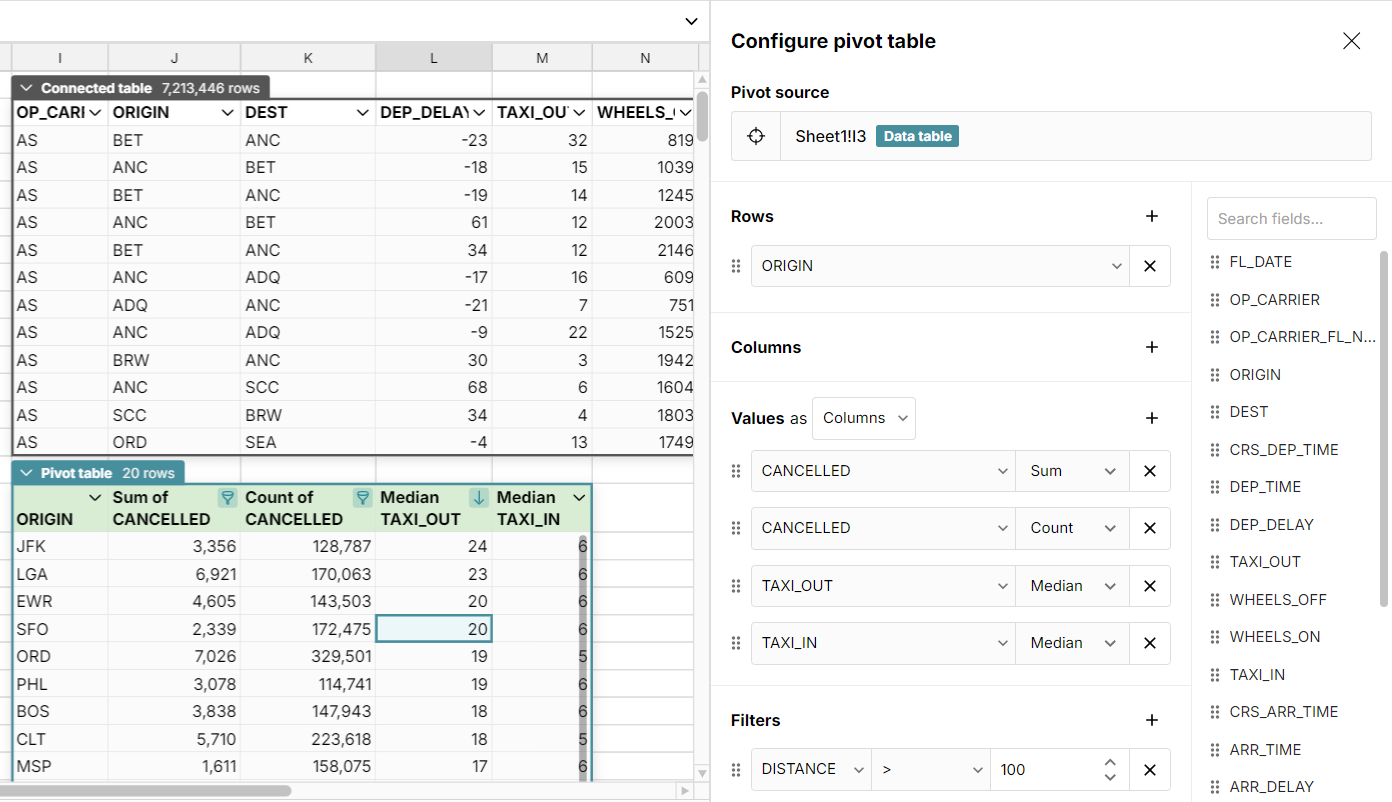
Bonus Points: Schedule data refresh
You can schedule data refresh to automatically update pivot tables in Row Zero. Click on any cell in your connected table to open the query editor, click on the calendar icon, and set up automated refresh. You can also edit or update your data manually at any time by re-running your SQL query. Any time your source data updates, your pivot table automatically updates. 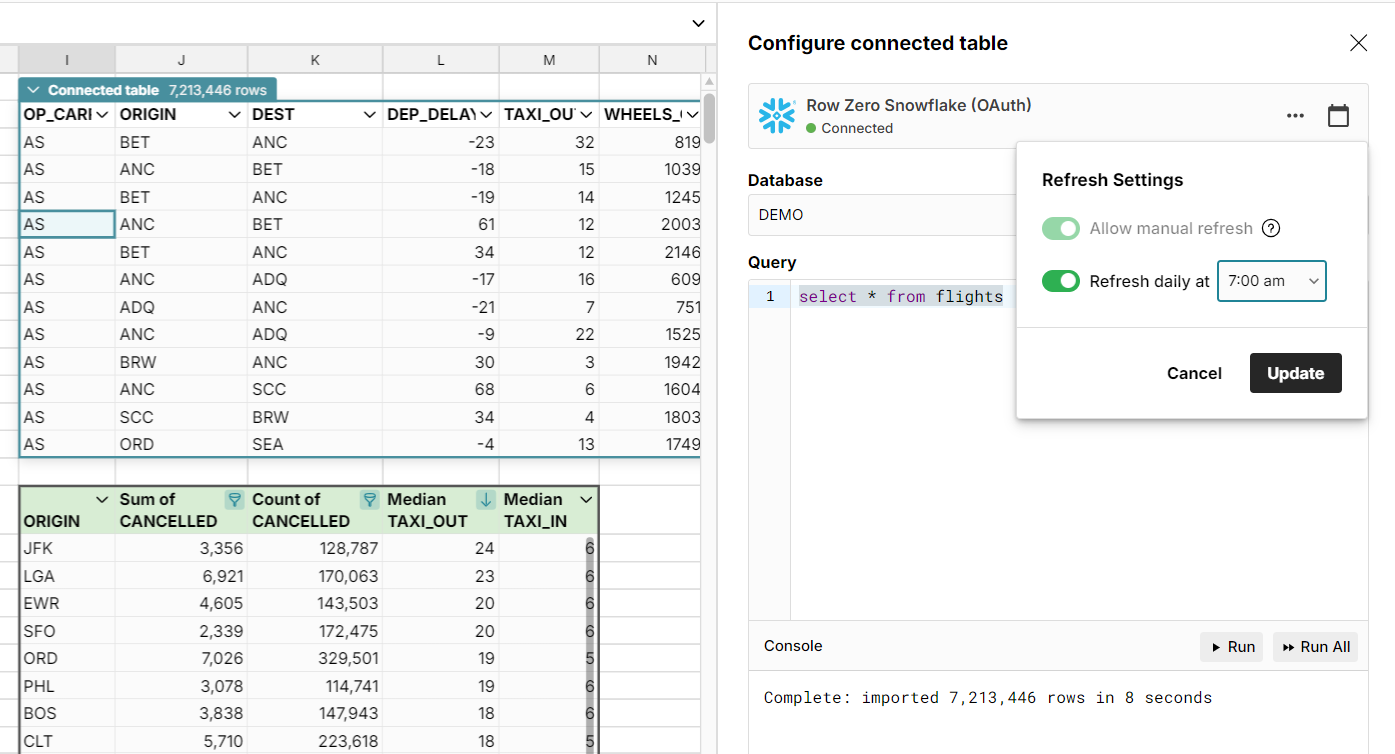
How to create a dynamic pivot table from cells: Row Zero
Open up a workbook in Row Zero:
Login or sign up for free to get startedGet your data ready
You can start from scratch or click Data in the top navigation to import a file directly from your computer, URL, or Amazon S3. You can choose to import as a data table or import into cells.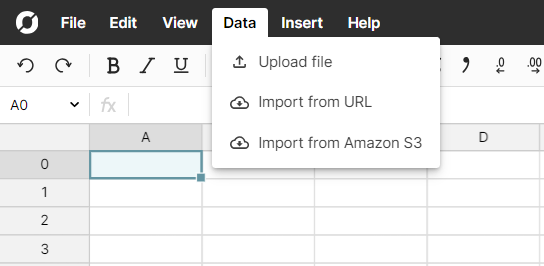
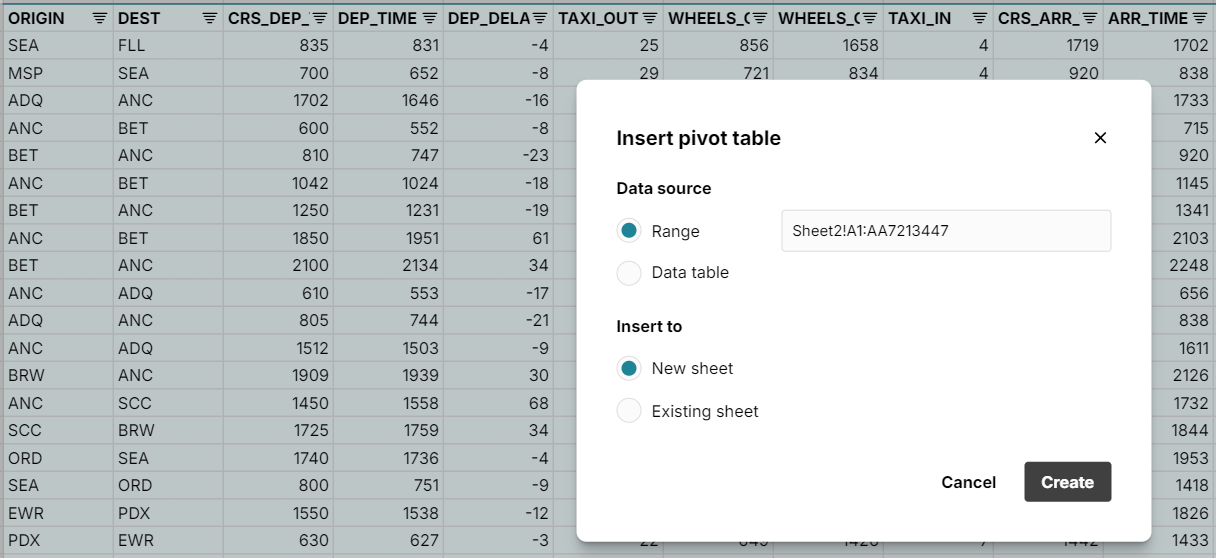
Select your data and insert pivot table
Choose your rows, columns, values, and filters
Here's a tutorial on how to create pivot tables if needed.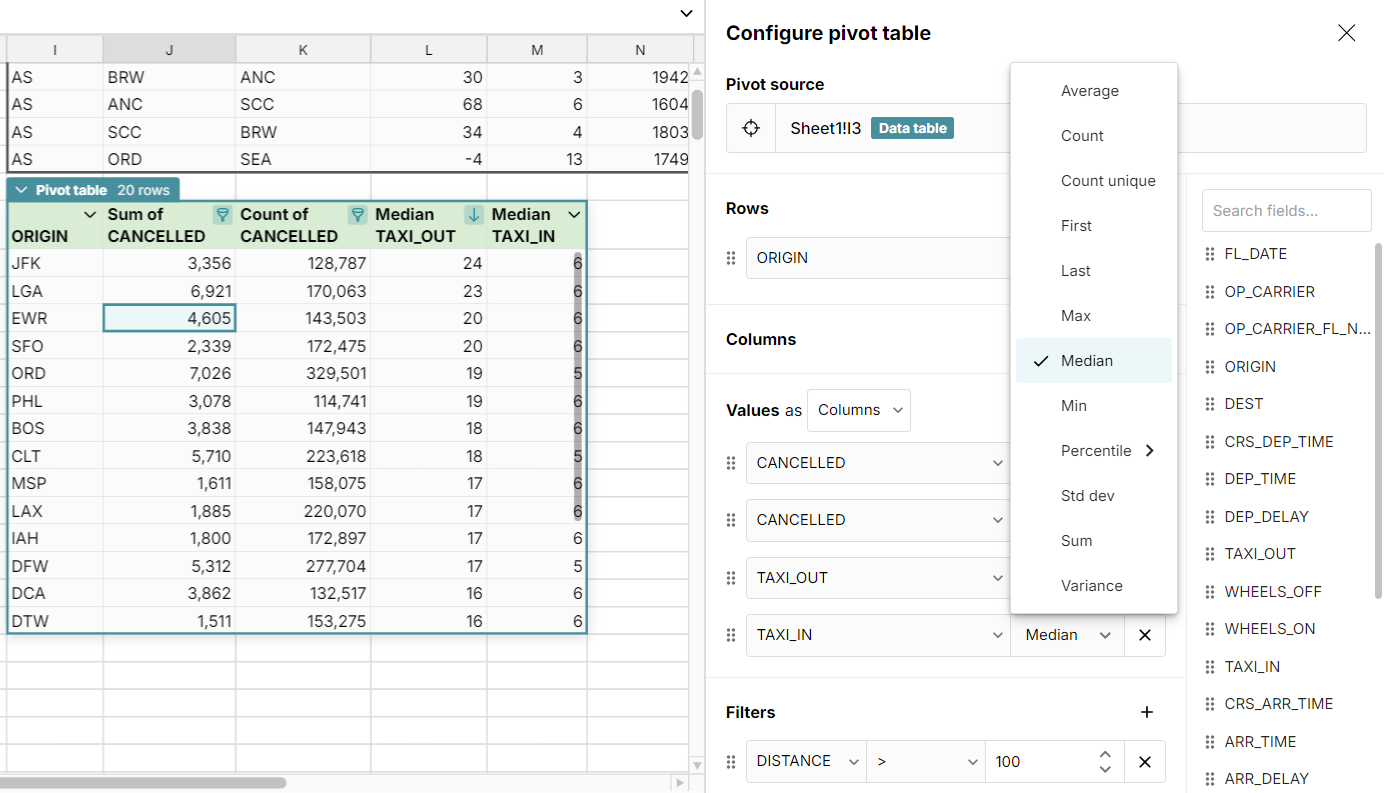
Result: A dynamic pivot table that automatically updates with your data
You've created a dynamic pivot table that updates in real-time as you change your source data. If you go to your source data and change a cell, delete a row, or add a row, your pivot table auto updates in real-time.
Bonus Points: Take your pivot tables further
In addition to making it easy to format, filter, and sort pivot tables, Row Zero lets you use your pivot tables as source data just like any other cells. Create pivot charts, pivot your pivot table, build formulas on your pivot table (XLOOKUP, SUMIFS, etc), or create a pivot table dashboard of multiple pivot tables from multiple sources. You can even export pivot tables to your data warehouse where they can be pulled anywhere. 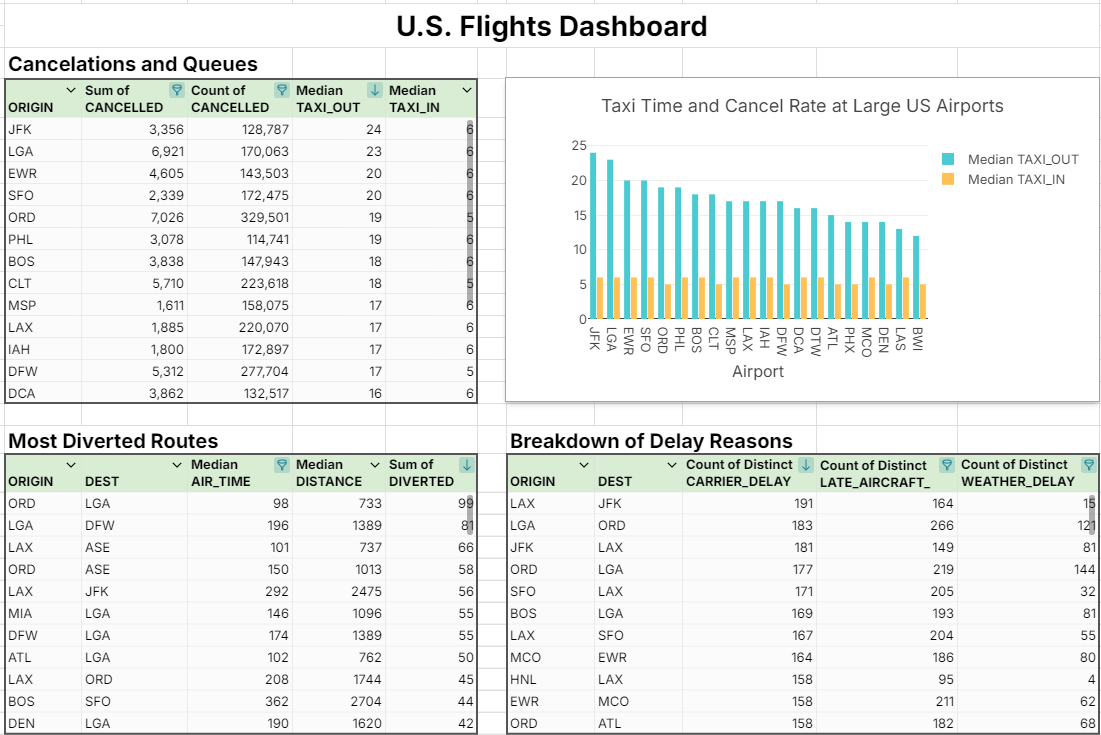
Try Dynamic Pivot Tables in Row Zero
Dynamic pivot tables in Excel
It's a bit more challenging to create dynamic pivot tables in Excel and by default, Excel pivot tables are less dynamic than Row Zero and Google Sheets and have some pretty significant limitations. We also cannot use the same dataset we used in the Row Zero example above, which had 7.2 million rows, because of Excel's data size limits, so we'll use a simpler dataset for this example. Despite these limitations, Excel does has a robust set of unique features. Let's take a look:
Creating an Excel pivot table
Open up a workbook in Excel:
If you don't already have Excel, you can sign up for Excel 365 for free to get started.Get your data ready
You can start from scratch or click Data and then Get Data in the top navigation to import a file directly from your computer and other sources.Select your data and insert pivot table
Select the data you want to pivot and click Insert and then Pivot Table in the top navigation to create a pivot table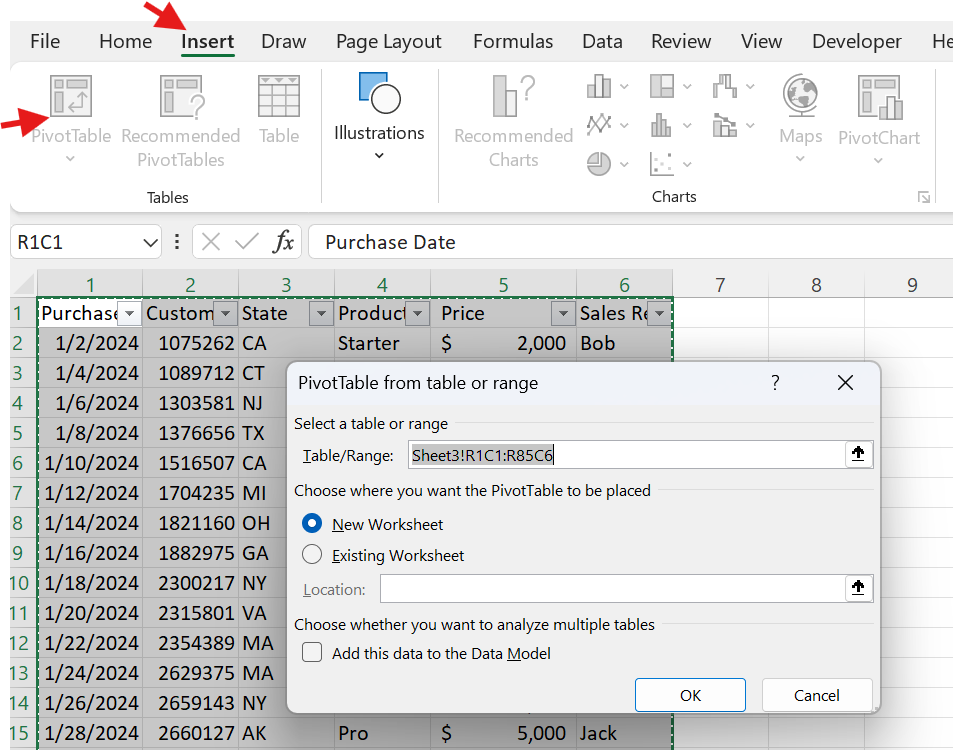
Select your pivot table fields
Drag your rows, columns, values, and filters to configure your pivot table.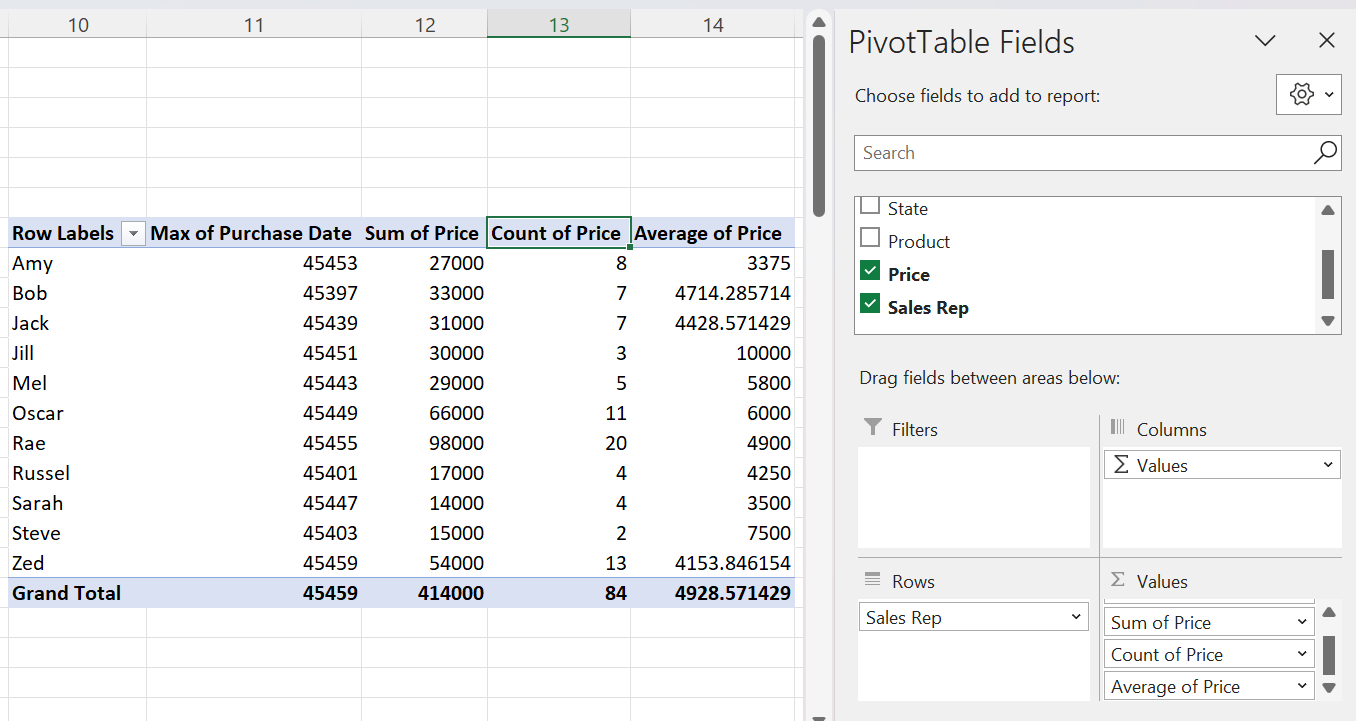 To change the calculation applied to a value field, click on the value and select "Value Field Settings".
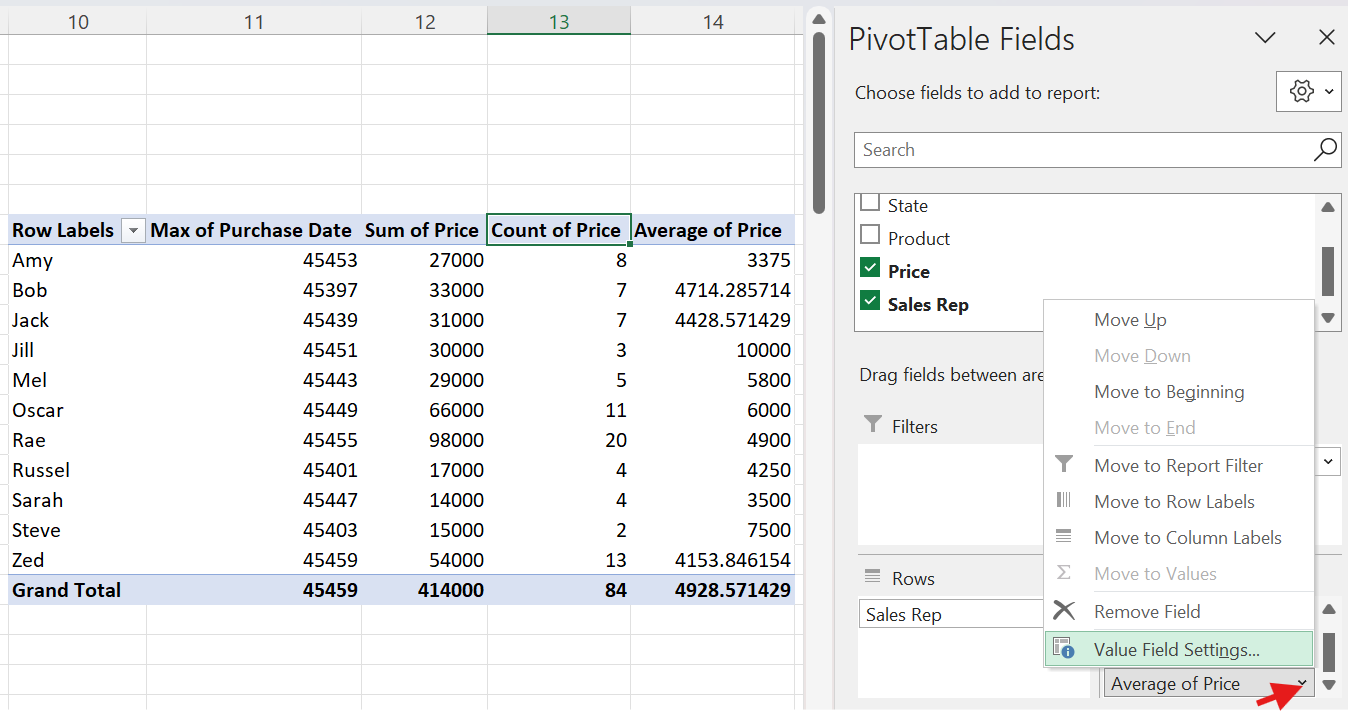
Result: A static pivot table you can manually update
NOTE: Excel pivot tables are NOT dynamic by default. By default, these pivot tables do not update in real-time as you change the source data. View the steps below for how to update Excel pivot tables.
Updating pivot tables in Excel
When you add or modify data in your source data range, Excel pivot tables do not automatically update in real-time. To update Excel pivot tables, you have a few options:
- The simplest way: Refresh Excel pivot tables with keyboard shortcuts: Alt + F5 to refresh only the active pivot table. Ctrl + Alt + F5 to refresh all pivot tables in the workbook.
- Click the PivotTable Analyze tab and click Refresh
- Right-click on the pivot table and select Refresh.
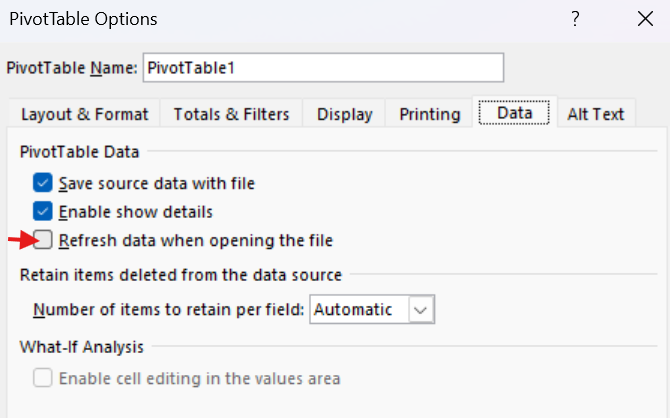
- Update on file opening: You can set Excel pivot tables to update automatically on file open. Right-click on the pivot table, choose PivotTable Options, go to the Data tab, and check Refresh data when opening the file.
As you can see, none of these actually support real-time auto-updating of pivot tables. One positive is, like Row Zero, when you shrink or expand the source data range, Excel pivot tables will automatically accept those updates, but only with the next refresh action.
Using VBA to auto-update Excel pivot tables
You can set use VBA to set up Excel pivot tables to update automatically. Here are the steps:
1. Convert your data to a Data Table:
- Select your dataset.
- Go to the Insert tab and choose Table (or press Ctrl + T).
- Make sure the range covers all your data, and check the box for "My table has headers" if applicable.
2. Create a Pivot Table from your Data Table:
- Click inside your table.
- Go to Insert and select PivotTable.
- Make sure "Select a table or range" is set to the name of your data table.
- Choose where to place the pivot table (on a new or existing sheet).
3. Open the VBA Editor: Press Alt + F11 to open the Visual Basic for Applications (VBA) editor.
4. Insert a New Module: In the VBA editor, click Insert > Module.
5. Write the VBA Code: Use the following code to automatically refresh the pivot table whenever the data in the table is changed:
Private Sub Worksheet_Change(ByVal Target As Range)
   Dim PT As PivotTable
   On Error Resume Next
   For Each PT In Me.PivotTables
       PT.PivotCache.Refresh
   Next PT
End Sub
6. Assign Code to Your Worksheet: In the Project Explorer (on the left side), find the worksheet that contains your pivot table. Double-click on that worksheet, and paste the code in the window.
7. Save the Workbook as Macro-Enabled: Save your workbook as an Excel Macro-Enabled Workbook (.xlsm).
8. Test the Automation: Whenever you modify or add data to your table, the pivot table will update automatically.
Editing pivot tables in Excel
To edit Excel pivot tables, right click in the pivot table and scroll down to Show Field List to open up the Excel pivot table editor. 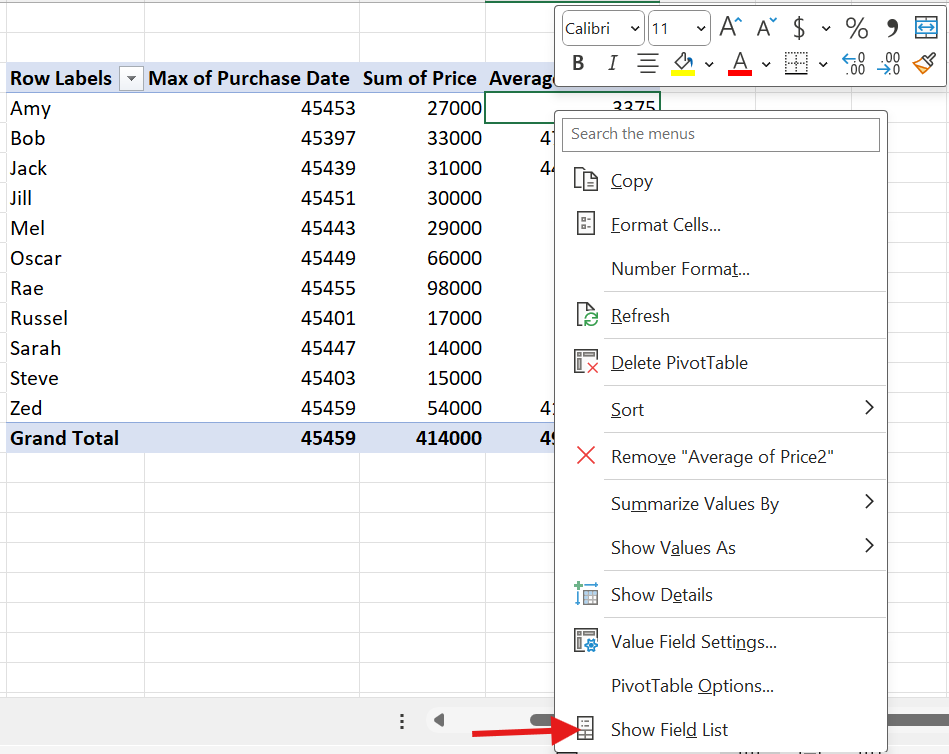
Working with Excel pivot tables
You can format, filter, and sort Excel pivot tables by clicking on the dropdown arrow in the first column: 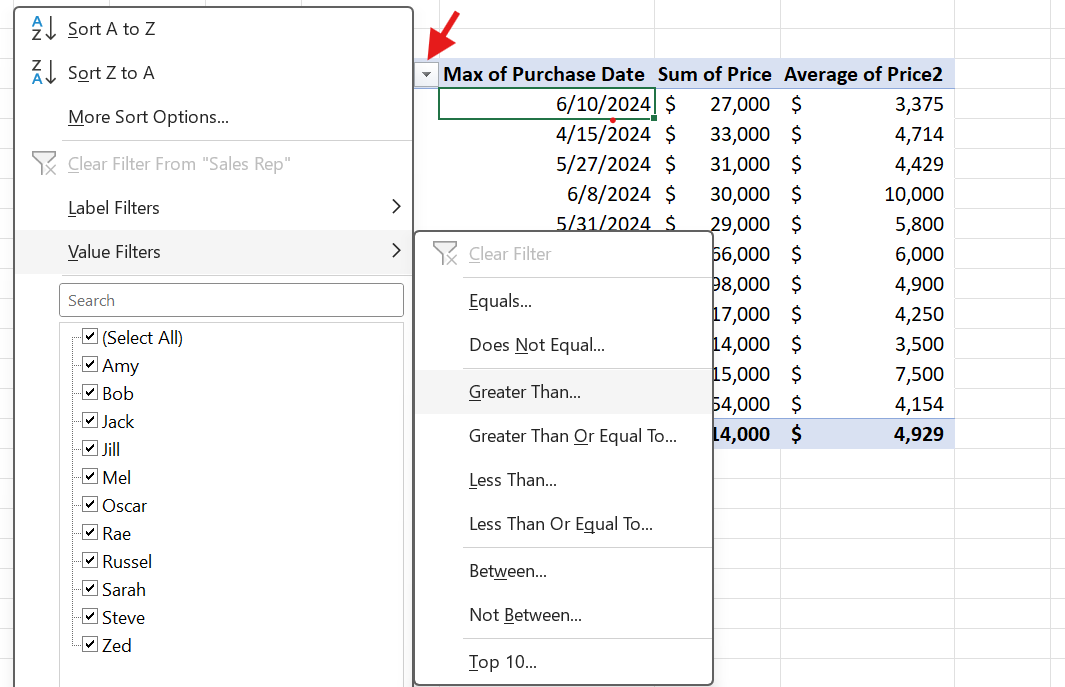
You can also build formulas on pivot tables in Excel using the GETPIVOTDATA() formula: 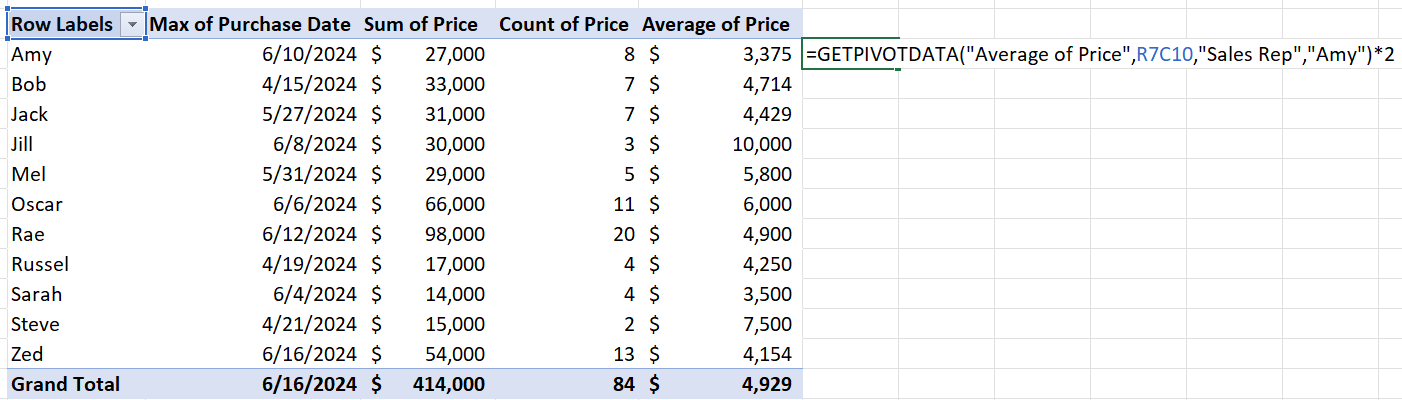
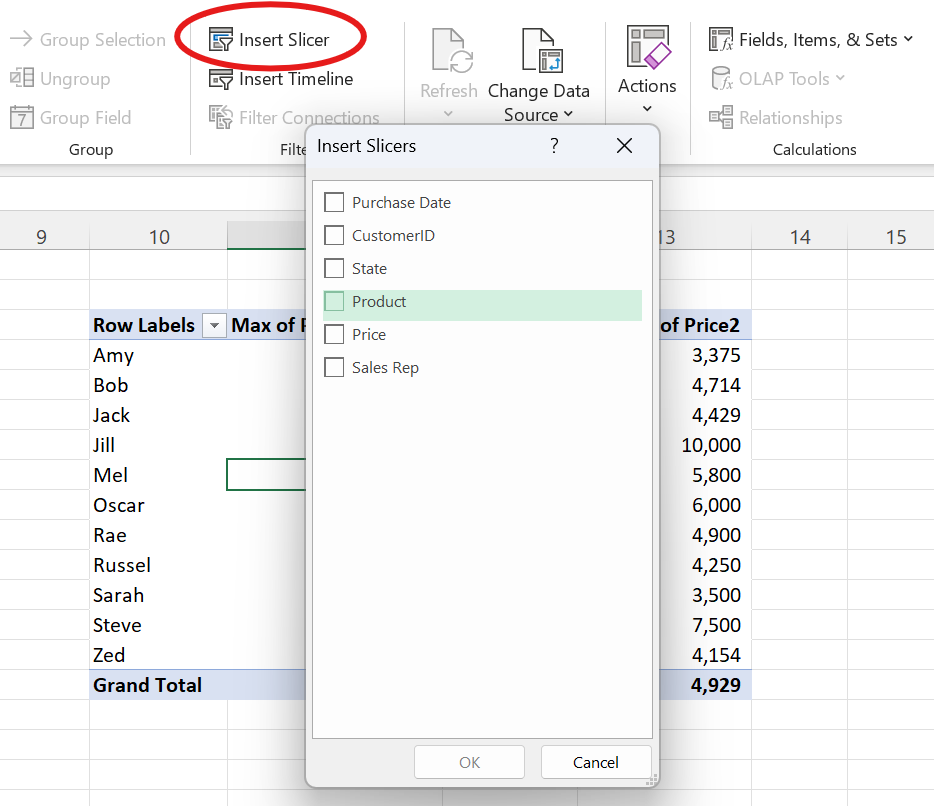
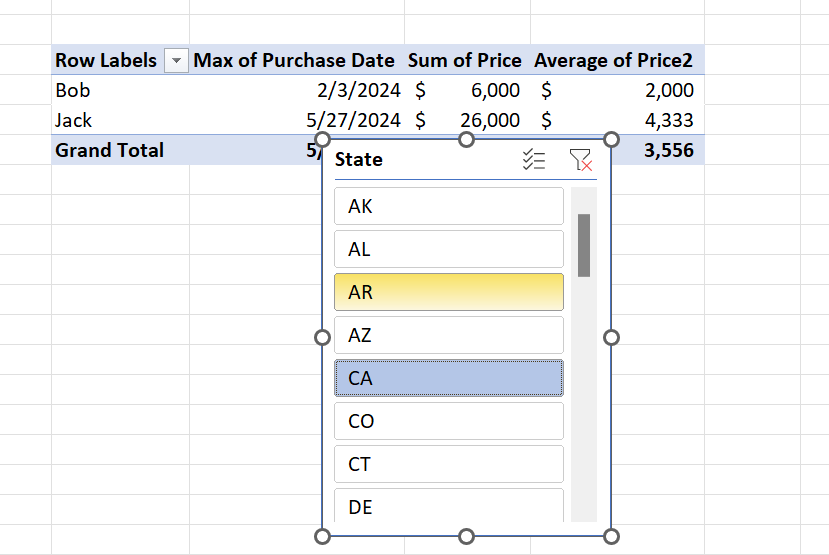
Excel also has some unique data filtering options like Insert Timeline and Insert Slicers which let you dynamically slice pivot table data further after the table has been created:
Excel size limitations
If you work with large datasets, you'll have to first do work to get your data size down below the Excel spreadsheet limit of 1,048,576 rows before creating your pivot tables. This sort of defeats the purpose of using a pivot table for big data in the first place, which is why Row Zero is a good Excel replacement for big data users.
Dynamic pivot tables in Google Sheets
It's a easier to create dynamic pivot tables in Google Sheets compared to Excel. Google Sheets pivot tables are dynamic by default and automatically update with data changes.
Creating a pivot table in Google Sheets
Open up a workbook in Google Sheets:
If you don't already have Google Sheets, you can sign up for free for a personal account.Get your data ready
You can start from scratch or click File and then Import in the top navigation to import a file directly from your computer, Google Drive, and other sources.Select your data and insert pivot table
Select the data you want to pivot and click Insert and then Pivot Table in the top navigation to create a pivot table.Select your pivot table fields
Drag your rows, columns, values, and filters to configure your pivot table. To change the calculation applied to a value field, adjust the dropdown under "Summarize by"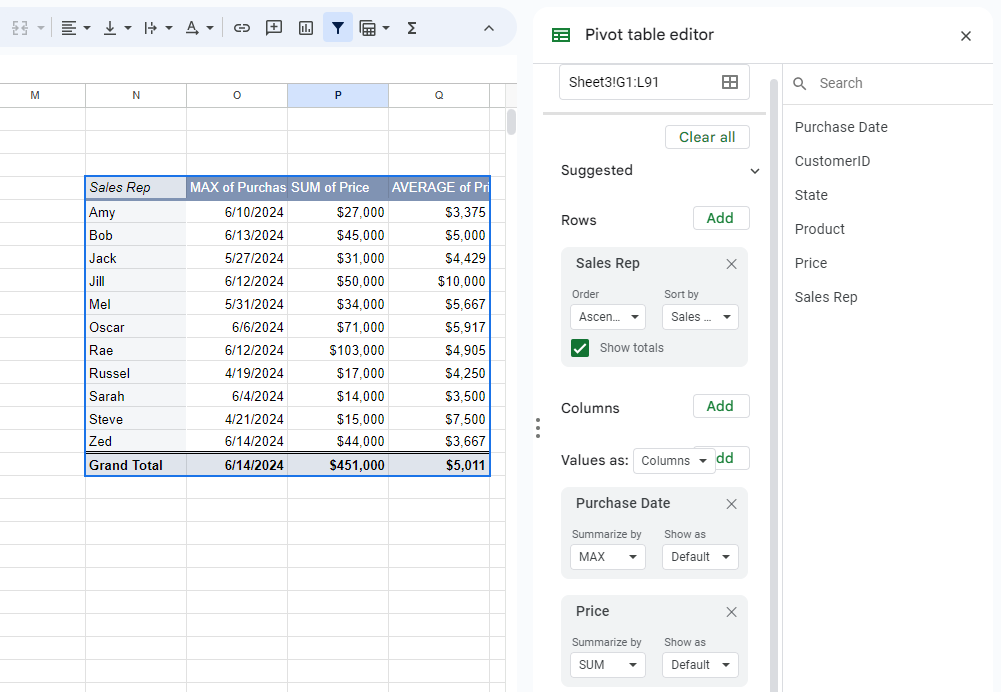
Result: A dynamic pivot table that updates with changes
Google Sheets pivot tables auto update in real-time when you modify source data.
Working within Google Sheets pivot tables
One drawback of Google Sheets is that you cannot sort or filter pivot tables in Google Sheets in the output table view. Your best bet is to copy and paste the cells within the pivot table and then apply filters. To edit pivot tables in Google Sheets, just click the pencil icon underneath the pivot table, which opens the pivot table editor.
You can easily build formulas on pivot tables in Google Sheets just like any other cells: 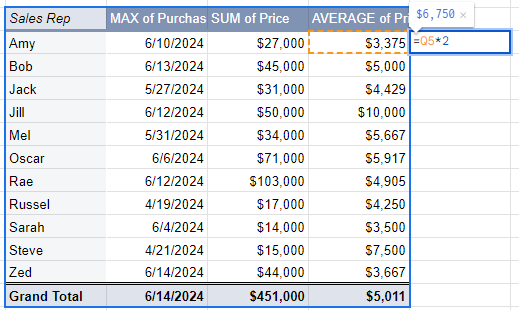
Connecting to data sources
Compared to Row Zero, it's more work to connect to your data warehouse and other data sources but possible using Google Sheets add-ons or purchasing connectors like Coupler.io or Coefficient.io. The Google Sheets add-on marketplace includes connectors to data sources like Snowflake, Databricks, Salesforce, Hubspot, Quickbooks, etc.
Size limitations
Similar to Excel, if you're working with large datasets, you may need to trim your dataset to get below the Google Sheets size limit of 10 million cells. And similar to above, Row Zero is a good Google Sheets replacement for big data users in these cases.
Conclusion
Dynamic pivot tables are powerful tools to actively analyze large datasets that frequently change. They're especially useful when connected directly to your data warehouse or source data. Row Zero pivot tables are truly dynamic. They update automatically as source data changes, allow you to seamlessly sort and filter pivot table columns, and make it easy to build formulas from pivot tables. Most importantly, Row Zero spreadsheets can handle massive, billion row datasets, which allow you to pivot database tables, pivot pivot tables, and build dashboards of multiple pivot tables from multiple sources. If you work with big data, Row Zero is the best spreadsheet for you. Ready to try it out?