Pivot tables are a powerful tool within spreadsheets that allow you to summarize, analyze, and explore large datasets. Pivot tables can quickly transform a dataset into a more understandable and insightful format. By dragging and dropping fields, you can create instant summaries, sort data, calculate averages, and more. Essentially, pivot tables help you see the big picture by condensing extensive data into a digestible format.
This pivot table tutorial will help you get started with pivot tables and learn why pivot tables are among the most popular spreadsheet features. Skip to specific sections using the links below or continue reading for the full guide.
- Simple example of how to build a pivot table
- Why use pivot tables?
- Limitations of pivot tables
- A Better Pivot Table: Dynamic Pivot Tables with Row Zero
- Conclusion
Simple example of how to build a pivot table
Let's walk through a basic pivot table example using a dataset of sales records. For this sample pivot table, we'll use Row Zero but pivot tables in Google Sheets or Excel will work in a similar manner.
You can view this example pivot table with easy instructions live on Row Zero or follow the instructions below. Pivot Table Example
The instructions below show how you can create this pivot table.
Sample Starting Dataset: 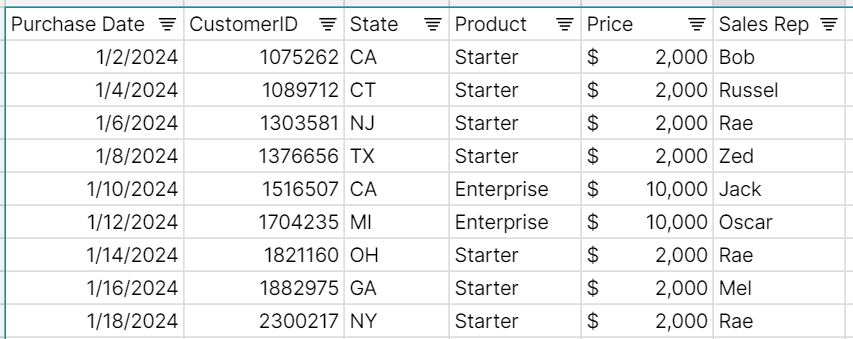
Steps to Create a Pivot Table:
Select Your Data: Highlight the data you want to use for your pivot table or click Ctrl+A to select all.
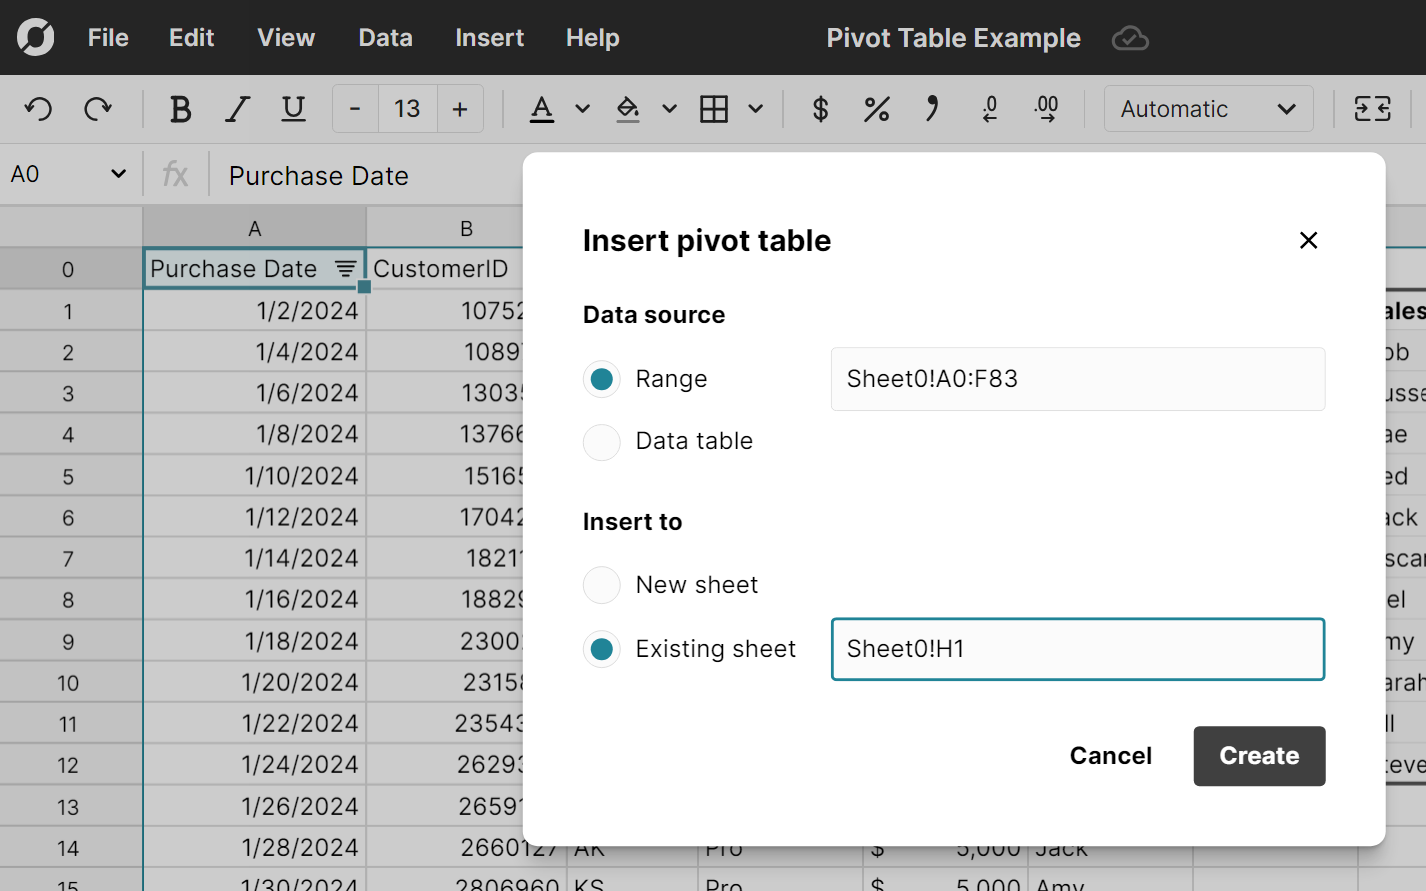
Insert Pivot Table: Go to the "Insert" tab and click on "Pivot Table". Choose where you want the pivot table to be placed (either in a new worksheet or in the existing one).
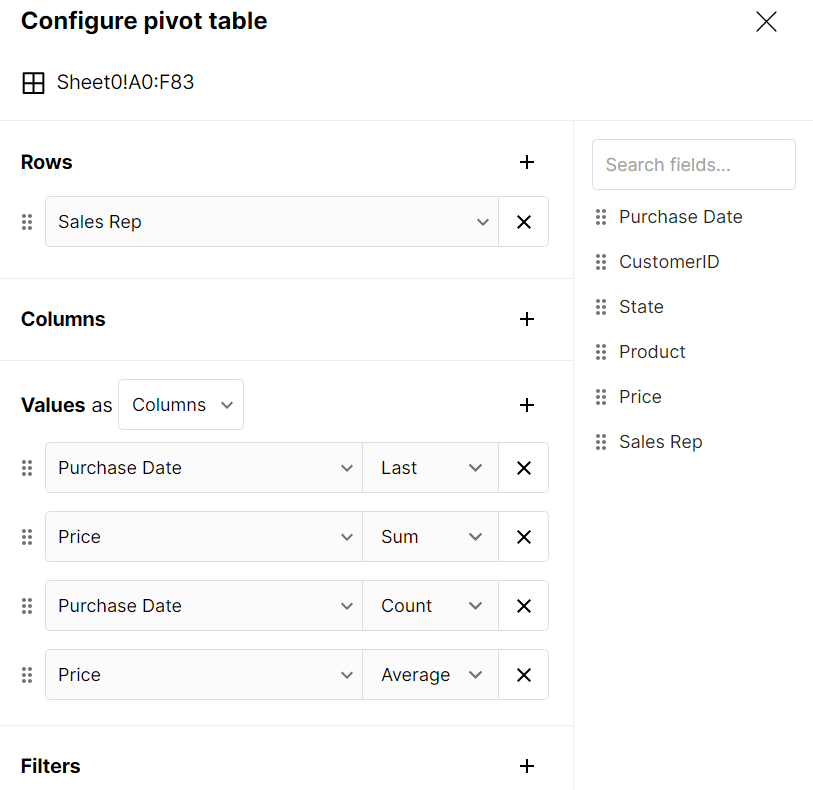
Drag Fields to Areas: For Rows and Columns, think of these as "a row for each" or "a column for each" of whatever you drag to it. You'll always want to use Rows, but it's common not to use Columns. Drag to Values the things you want the rows to be measured on and the type of measurement (i.e. Sum, Average, etc). Finally, you can optionally drag to Filter to further filter your view.
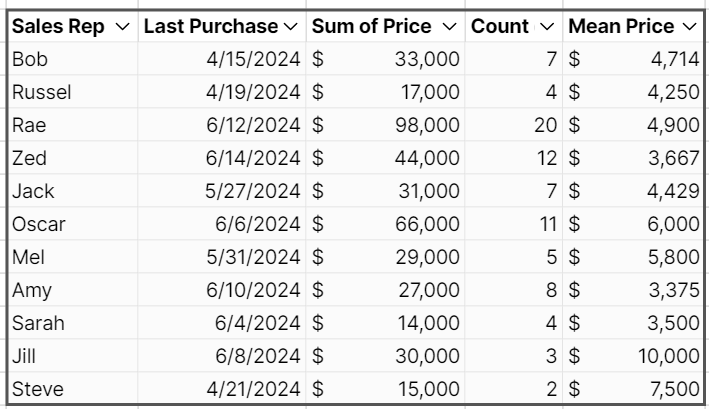
View the Result: Here is the result that has a row for each Sales Rep and then shows you their last sale date, total sales, count of sales, and average sales price.
Edit Pivot Table (optional): After viewing the result, you can make whatever changes you want. Simply double click on any cell in the pivot table to open the pivot table editor.
Update Pivot Table (optional): By default, Row Zero and Google Sheets pivot tables are dynamic pivot tables that update automatically as you change source data. Excel pivot tables do not update automatically by default. To update Excel pivot tables, you can use a keyboard shortcut (Alt + F5) or right click the pivot table and select Refresh.
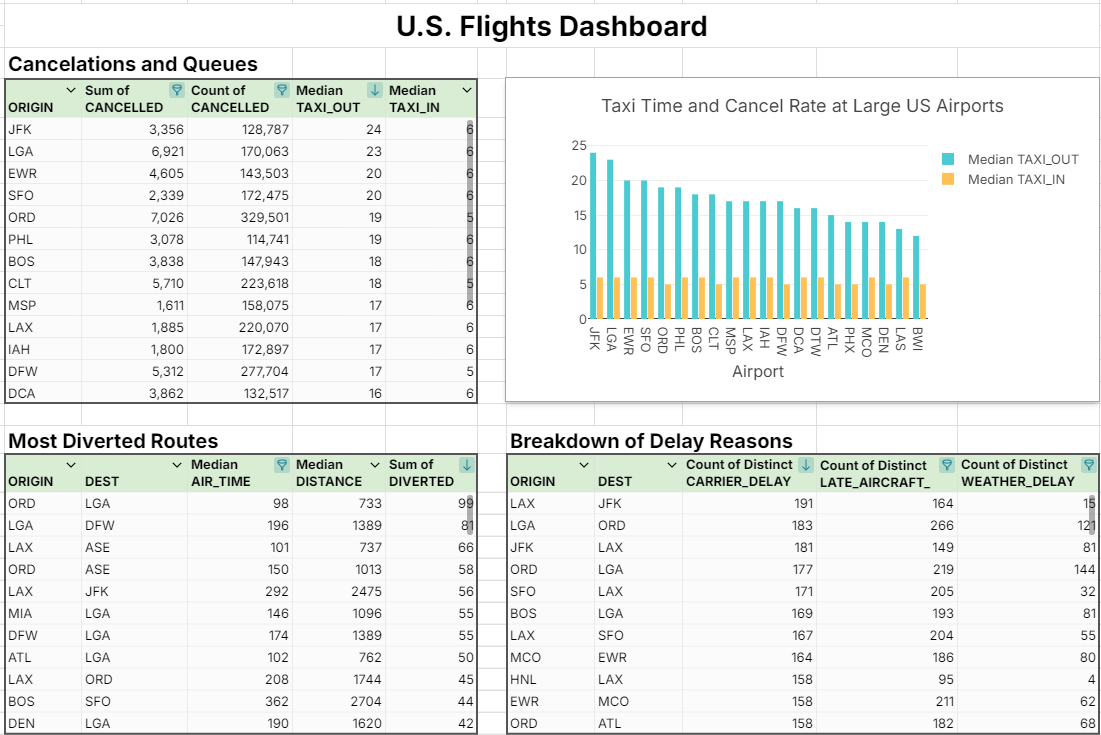
Build Upon Pivot Tables (optional): Row Zero lets you dynamically build on top of your pivot table. You can build forumlas from your pivot table data, create auto updating pivot charts, pivot a pivot table, and export a pivot table to a data warehouse like Snowflake or to a CSV. The example below shows an auto-updating pivot table dashboard with live pivot charts and cascading pivot tables to give you a sense of what is possible with pivot tables.
Why use pivot tables?
Pivot tables are favored by data analysts, accountants, marketers, and anyone who deals with large datasets in spreadsheets regularly. Here are 5 reasons why pivot tables are so popular:
- Efficiency: Pivot tables enable users to quickly summarize and analyze data without writing complex formulas or scripts.
- Flexibility: They offer a flexible way to manipulate data, allowing users to rearrange, filter, and sort data on the fly.
- Visualization: Pivot tables provide a clear and concise way to visualize data trends and patterns.
- Data Segmentation: Users can segment data into different groups, making it easier to identify trends and patterns within specific subsets.
- Decision-Making: The ability to summarize data quickly helps in making informed decisions based on the analyzed data.
Limitations of Pivot Tables in Excel and Google Sheets
Hopefully this pivot table guide helps you see the power of pivot tables. However, despite their many strengths, pivot tables in Excel and Google Sheets do have some limitations:
- Complexity with Large Datasets: While pivot tables can handle large datasets, extremely large datasets may slow down performance or cause the application to crash.
- Limited Calculation Options: Pivot tables offer basic calculation options, but for more complex calculations, additional formulas or tools may be required.
- Static Data: Pivot tables work with static snapshots of data. If the underlying data changes frequently, the pivot table may need to be refreshed manually.
- Learning Curve: There is a learning curve associated with mastering pivot tables, especially for users who are new to data analysis.
A Better Pivot Table - Dynamic Pivot Tables with Row Zero
The limitations of Excel pivot tables inspired the team at Row Zero to build a better pivot table. Row Zero is a next-gen spreadsheet built for big data that supports billion row spreadsheets so you can build big data pivot tables with ease. You can connect pivot tables to your data warehouse and build auto-updating pivot tables and pivot charts and automatically group pivot tables by date (day, week, month, quarter, etc.). Row Zero pivot tables are truly dynamic pivot tables that are easy to create and work with.
Conclusion
Pivot tables are a powerful tool to quickly analyze large datasets. While pivot tables were popularized by spreadsheets like Excel and Google Sheets, modern spreadsheets like Row Zero support advanced pivot tables that automatically update and connect live to your data source. Most importantly, Row Zero pivot tables can analyze massive datasets (1,000x Excel's limits) letting users of all technical levels quickly analyze large datasets in the comfort of a spreadsheet. Row Zero is a free online spreadsheet with advanced features for enterprise use.