Count Unique is a very helpful spreadsheet function that counts the number of unique values in a range. Using Count Unique in a pivot table lets you easily count the unique values across mulitiple slices of your dataset in one simple view.
This quick guide walks through how to create a pivot table that counts unique values across three popular spreadsheet apps - Row Zero, Google Sheets, and Excel from easiest to hardest. Jump to specific sections using the links below or continue reading for the full guide.
Easiest to Hardest: Count Unique in Pivot Tables
- Row Zero: Count Unique in a Pivot Table
- Google Sheets: Count Unique in Pivot Table
- Excel: Distinct Count in Pivot Table
1. Two Easy Ways to Count Unique with Row Zero
Row Zero is a next-gen spreadsheet built for big data and offers two easy ways to Count Unique in a spreadsheet.
Built-in Count Unique in Pivot Table
Row Zero has a built-in Count Unique in pivot tables that lets you easily count unique values. Simply create your pivot table, drag the field you want to pivot on to rows, and drag whatever you want to count unique to Values and select Count Unique.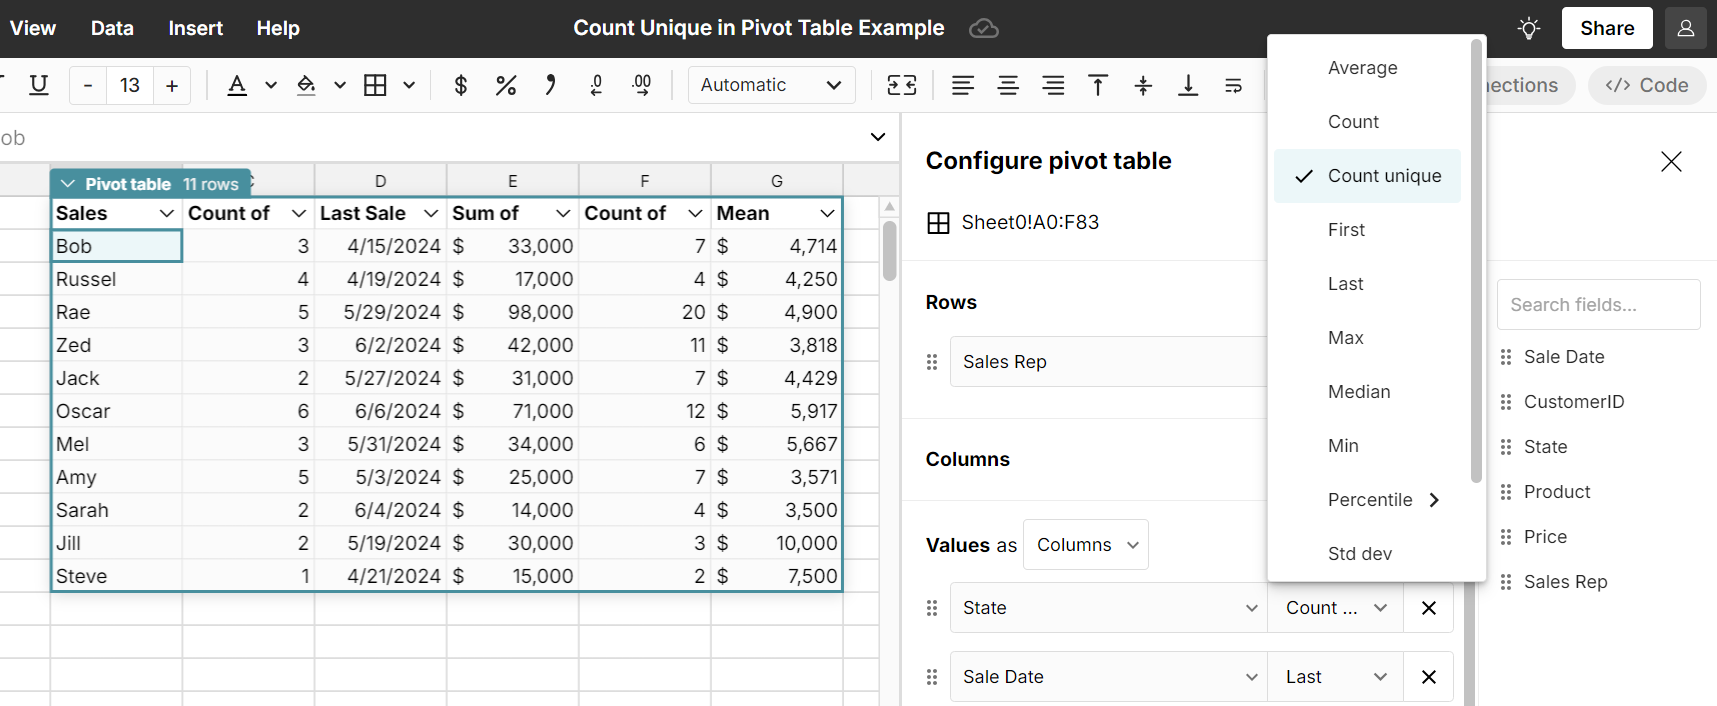 Here is a live example pivot table count unique so you can see exactly how it works and here is a step-by-step video on how to count unique values in a pivot table:
COUNTUNIQUE() formula function: Shortcut to Pivot Count
Row Zero also has a built-in COUNTUNIQUE() function that lets you easily count uniques without even building a pivot table by using the formula =COUNTUNIQUE(). This returns the unique values and their counts of a range or column and is a quick shortcut to pivot and count.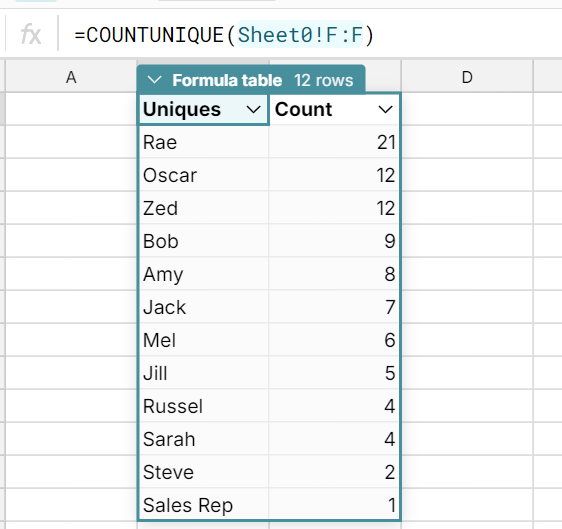
Try Count Unique with Row Zero
2. Google Sheets Count Unique in Pivot Table
Google Sheets also has a built-in pivot table count unique function. Counting unique values in Google Sheets is similar to Row Zero. Go to Insert, Pivot Table to create your pivot table, and then drag your rows and whatever you want to count unique to Values and select Count Unique. 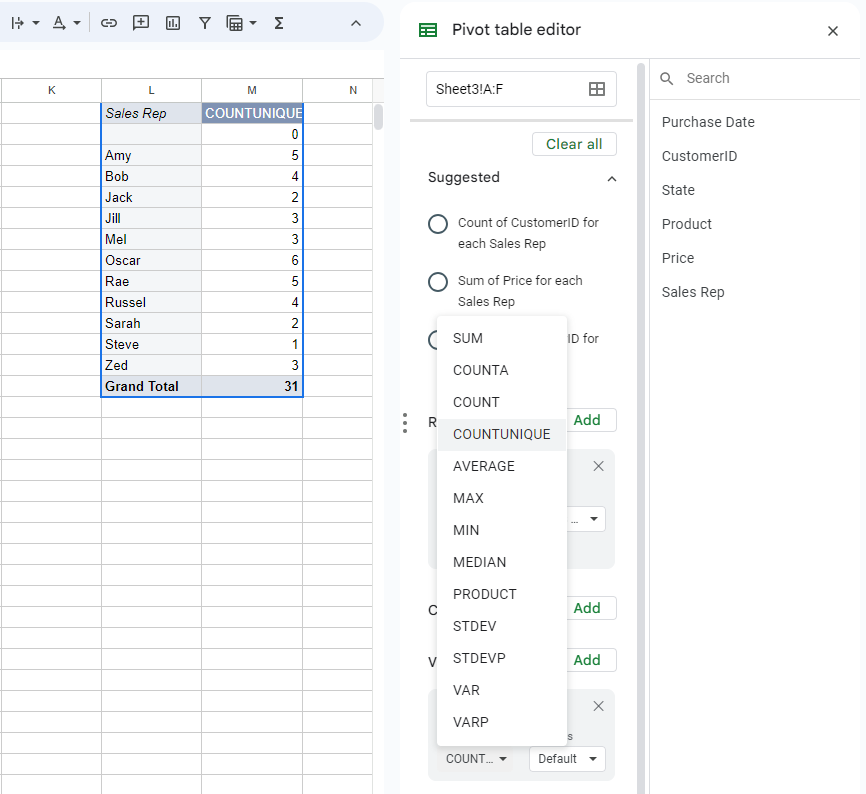
Similar to Row Zero, Google Sheets also offers a COUNTUNIQUE() formula function as well.
3. Excel Distinct Count Pivot Table
Excel does not have a built-in Count Unique in pivot table function by default, but there is a way to make it work. When you create your pivot table, you need to check the box next to "Add this data to the Data Model" and click OK. 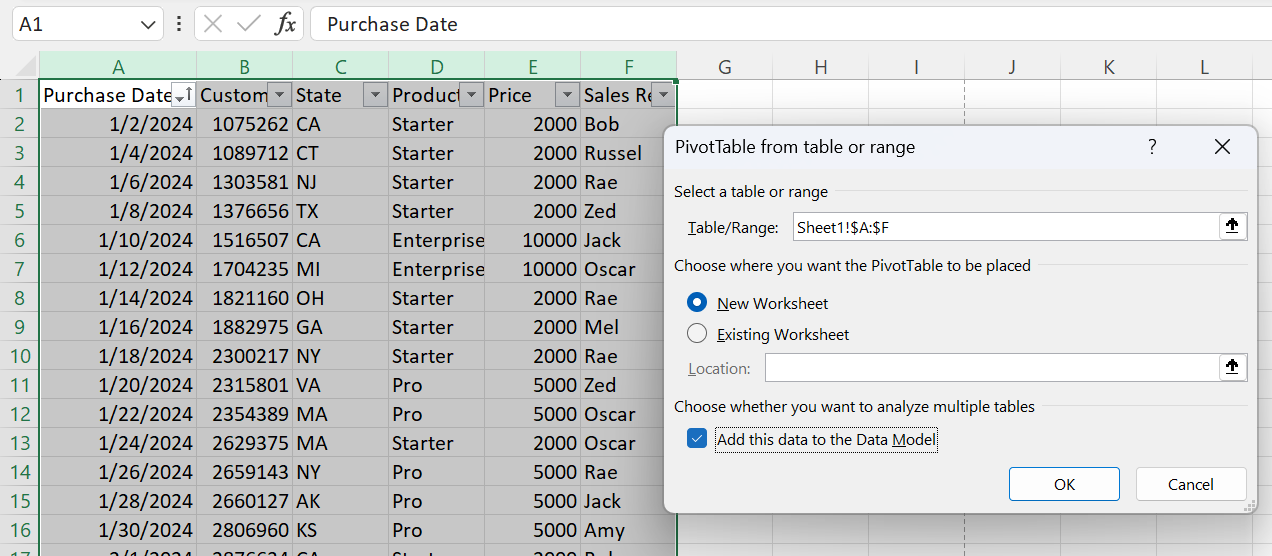
Drag your rows and whatever you want to count unique to Values. Click the dropdown toggle for the field in values and select Value Field Settings. 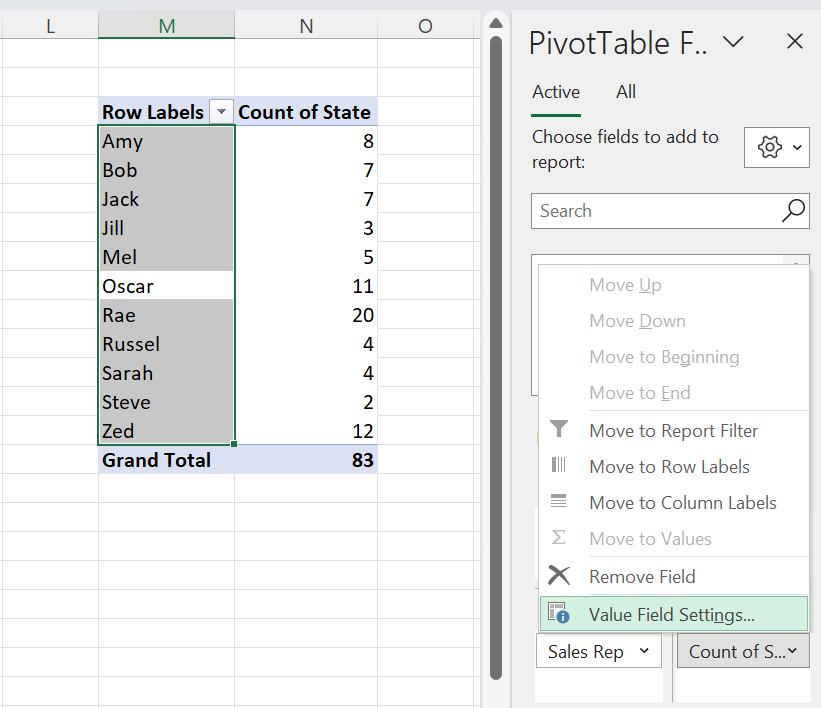
Scroll down to select Distinct Count and click OK. 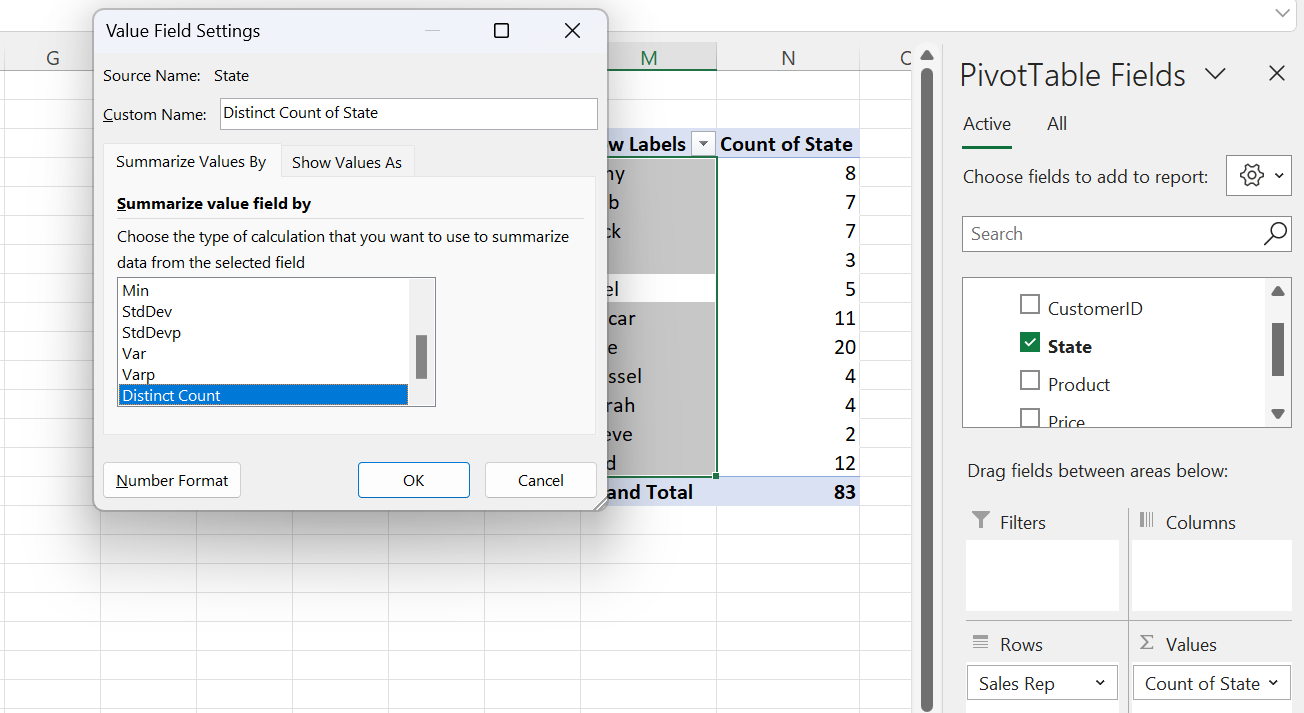
This creates an Excel pivot table with distinct counts for each field in Values. Count distinct in Excel pivot tables is very similar to count unique in Google Sheets and Row Zero.
Conclusion
Count Unique if a very helpful tool when analyzing data in a spreadsheet. Row Zero and Google Sheets are similar in offering a default Count Unique option in pivot tables as well as a COUNTUNIQUE function to easily count uniques in a spreadsheet without even building a pivot table by using the formula =COUNTUNIQUE(). Microsoft Excel does not have a default Count Unique option in pivot tables but does offer a way to Count Distinct by selecting "Add this data to the Data Model" when creating a pivot table. If you need extra help, you can view a live example of pivot table count unique at Row Zero so you can see exactly how it works.
If you want to work with large datasets in a spreadsheet, check out Row Zero. Row Zero is similar to Excel and Google Sheets but is super fast, can handle much bigger datasets, and can connect live to data warehouses and databases like Snowflake and Postgres.