Pivot tables make it easy to analyze large datasets. Sometimes it's useful to create pivot tables from pivot tables when doing a multi-step or multi-layer analysis. When you pivot a pivot table, the calculations and aggregations in your first pivot table are available as fields in your second pivot table, so you can do calculations of calculations and further analyze the aggregate summaries from your first pivot table.
Row Zero is a spreadsheet for big data that makes it easy to pivot a pivot table. Simply right-click on your pivot table and select 'Pivot' to create a downstream pivot table using your first pivot table as its source. View live examples of pivot tables from pivot tables here or try Row Zero for free to create your own multi-layer analysis.
In this guide we'll show how to create pivot tables from pivot tables and show common use cases for pivoting a pivot table.
- How to create a pivot table from a pivot table
- Use cases for pivoting a pivot table
- How to duplicate a pivot table
How to create a pivot table from a pivot table
Row Zero makes it easy to pivot a pivot table. Here's how:
- Open a new workbook and get your data ready - Login or signup for free to get started. You can import data from files or connect directly to your data warehouse.
- Create a pivot table - Select your data table or range and go to 'Insert', 'Pivot table' in the header navigation. Configure your pivot table rows, columns, values, and filters.
- Pivot your pivot table - Right-click on your pivot table and select 'Pivot' to create a pivot table using your current pivot table as its source.
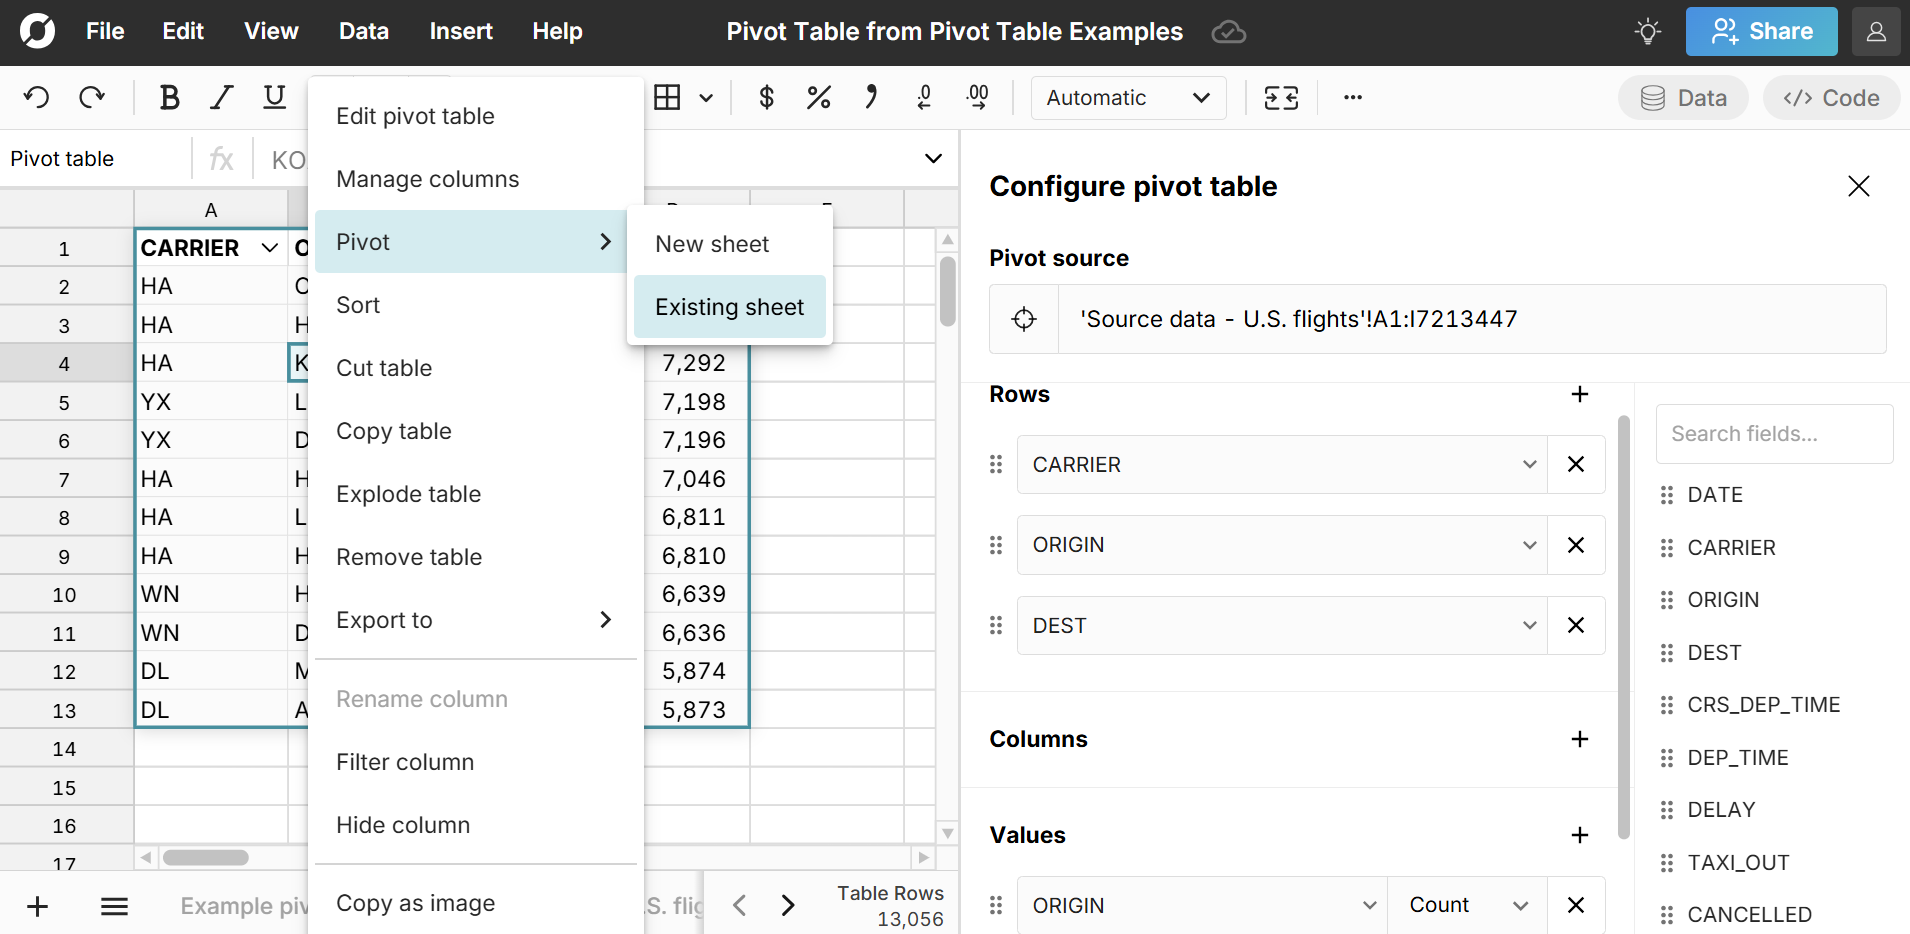
You can cascade multiple pivot tables as far as you want. Downstream pivot tables update in sync with their source pivot tables and the original source data. For example, if you update your original source data, your downstream pivot tables also update. Similarly, changes to your first pivot table will cascade to your next level pivot tables.
View a live example of pivot tables from pivot tables to see it in action
Use cases for pivoting a pivot table
There are many reasons to create a pivot table from a pivot table, especially when working with big, complicated datasets and transactional data. It can be helpful to pivot a pivot table when doing a multi-layer analysis, since the calculations and aggregations from your first pivot table are available as fields in your second pivot table. This lets you do calculations of calculations or re-pivot a pivot table that cleans, aggregates, or enriches your source dataset. Here are some examples that analyze a U.S. flights dataset, which has one row for each flight in the U.S. for one year. You can view the first 5 examples live in a spreadsheet here:
1. Calculation of a calculation
A simple and common use case for pivoting pivot tables is applying a calculation of a calculation. In the example below, the first pivot table aggregates our daily flight data by route and calculates the average flight delay for each route. 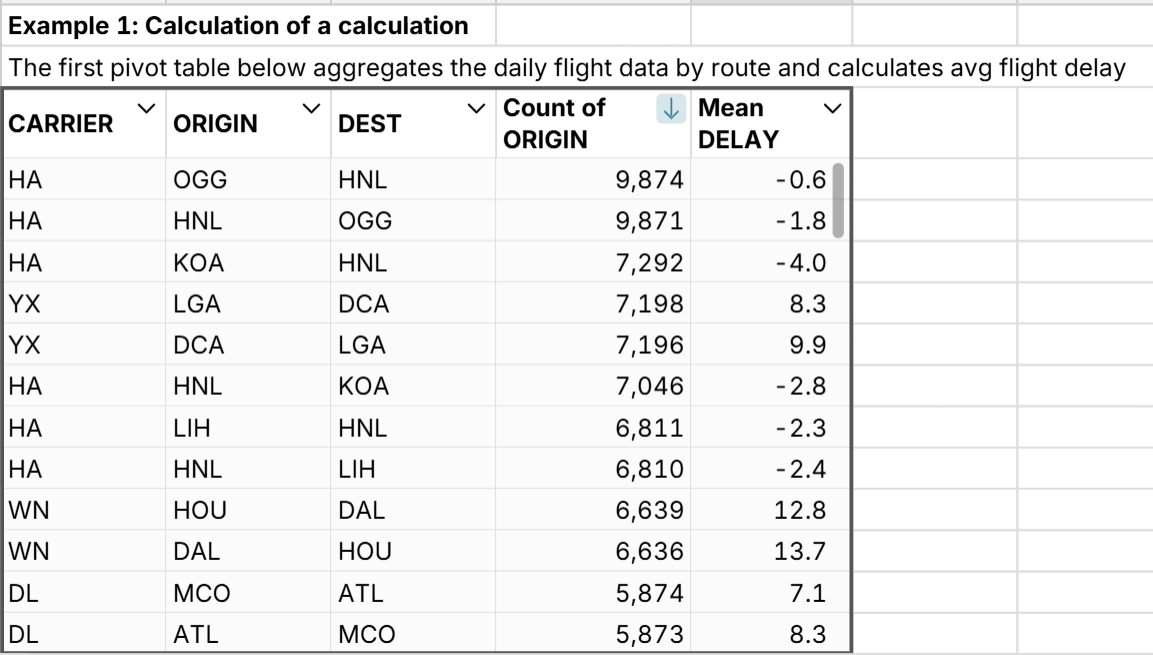
Right-click on the table and select 'Pivot' to pivot the pivot table. The calculated values from the first pivot table are now available as fields in the pivoted pivot table. 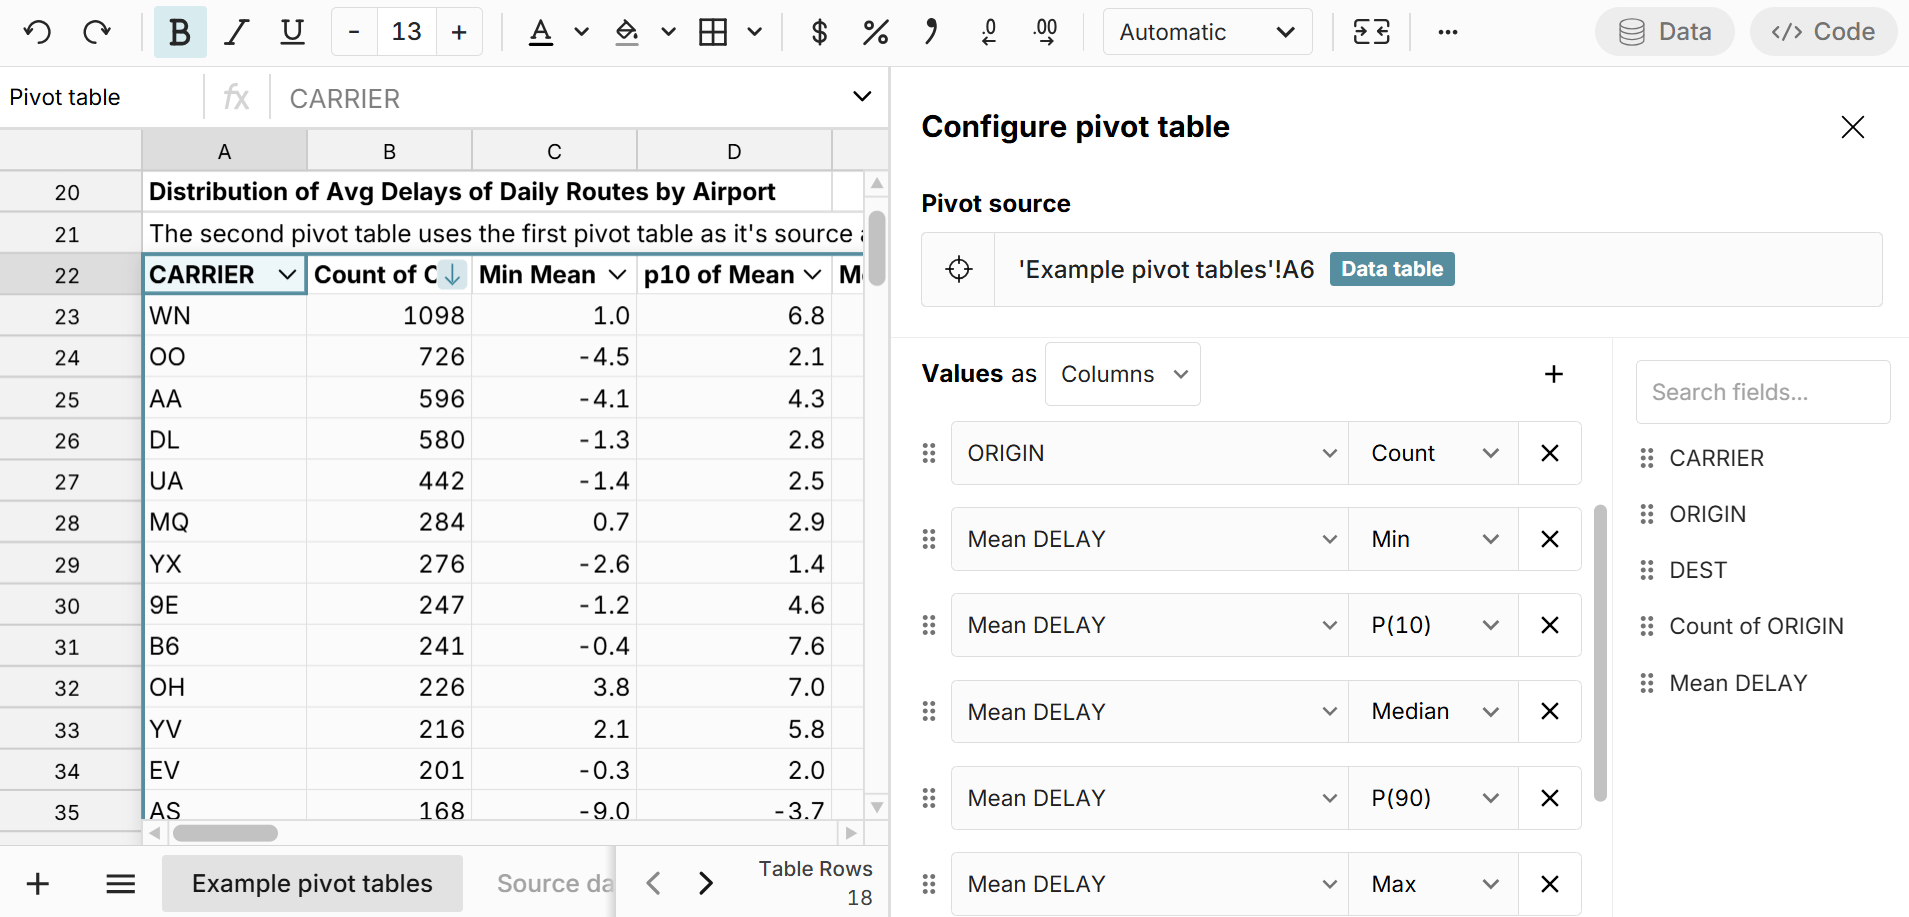
As you can see, pivoting a pivot table makes it easy to do calculations of calculations like mean of means, variance of means, medians of medians, etc. The first pivot table creates calculations for an aggregation level like categories, date groups (e.g. month), unique users, etc. and then the pivoted pivot table lets you further analyze your aggregation level calculations. You can cascade calculations as far as you'd like and make calculations of calculations of calculations.
2. Count unique across more than 2 attributes
Row Zero pivot tables have a built-in count unique calculation, but if you want to count unique across multiple attributes, pivoting multiple pivot tables makes it easy. Here's how:
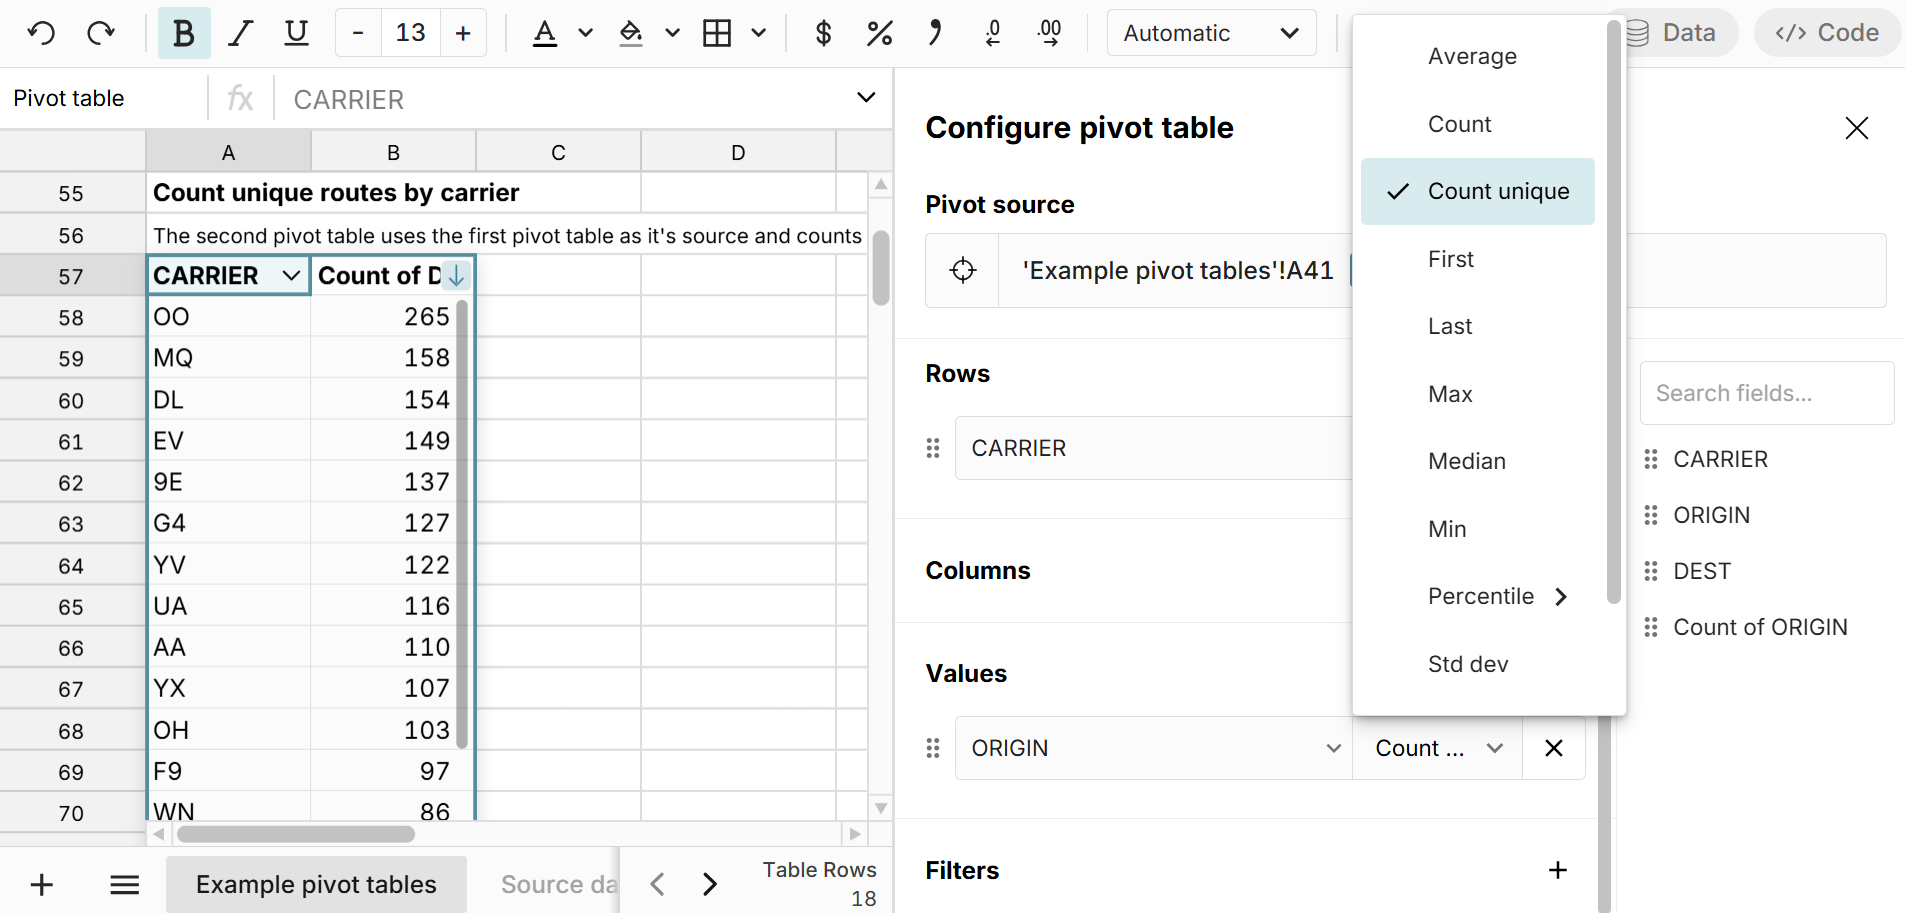
- Scenario: Our dataset has one row for each flight in the U.S. for one year. We want to count the number of unique routes by carrier.
- For the first pivot table, we just set up one row for each unique route by pulling Carrier, Origin, and Dest to rows and then add a count to look at total flights by route.
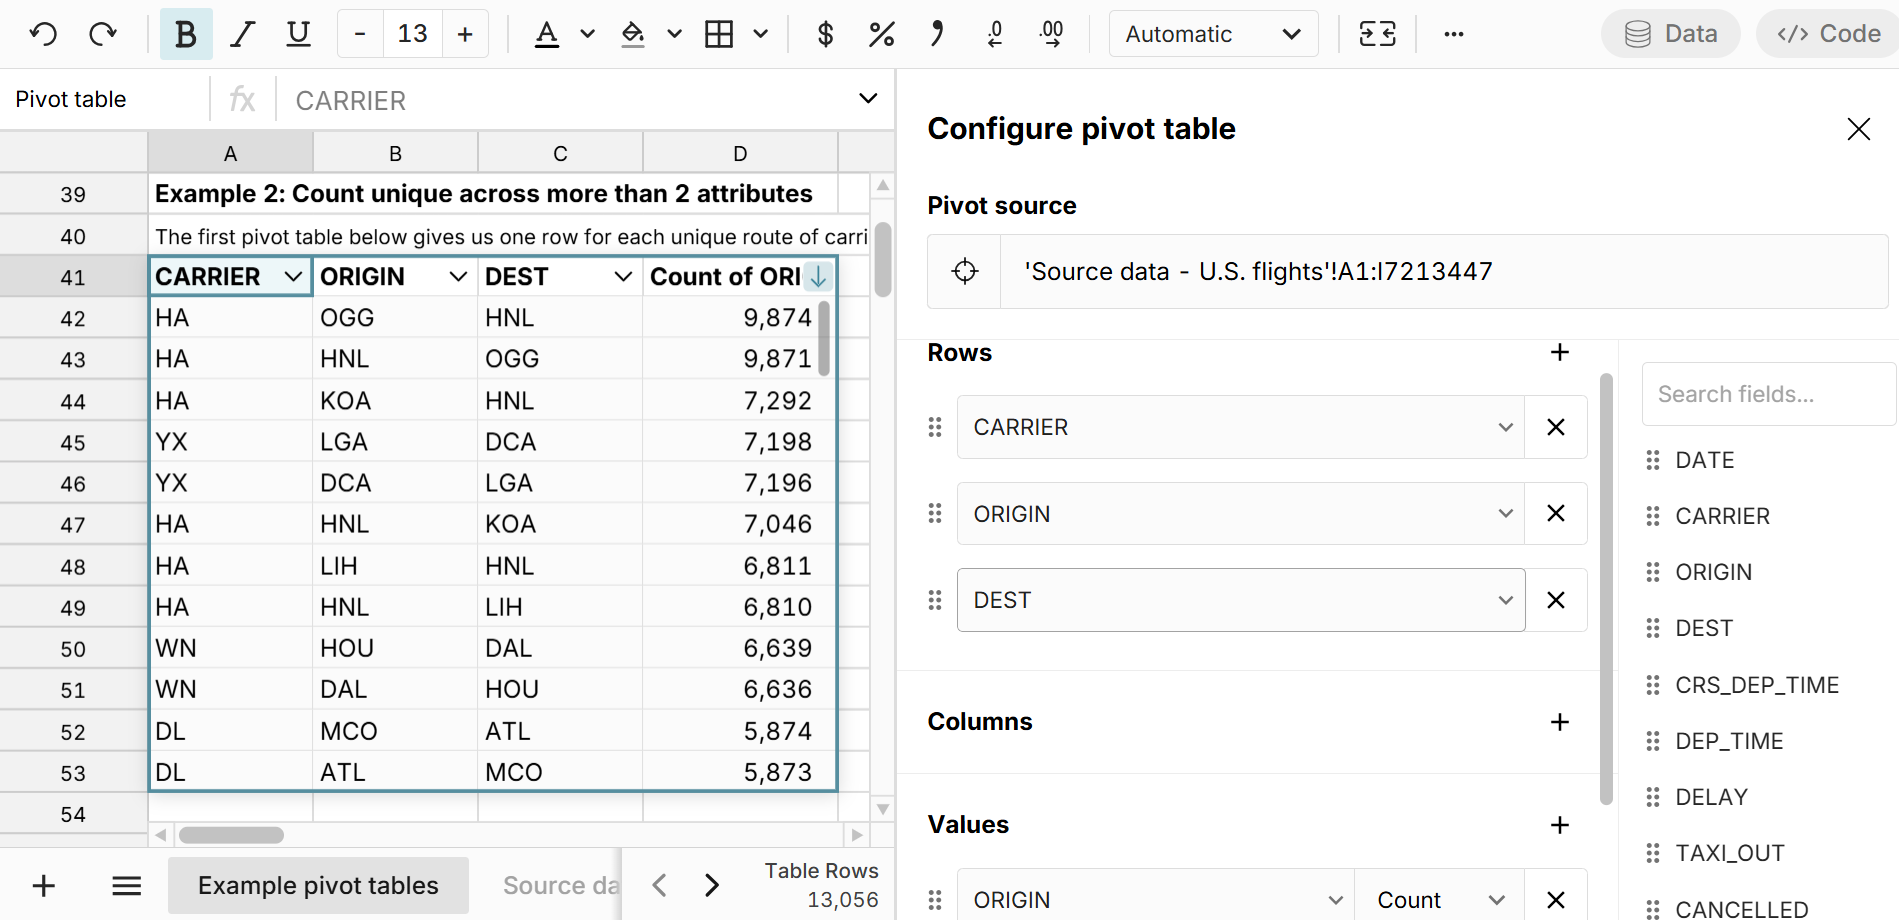
- We can then right-click on the pivot table and select "Pivot' to create a new pivot table from this pivot table to count the unique routes by Carrier. Here we pull Carrier to Rows and Origin to Values and select 'Count Unique' as the calculation. This give us a 2nd level pivot table that counts the unique routes by carrier.
3. Calculation with filter applied
Pivoting a pivot table is also helpful when you want to apply calculations to a filtered aggregation of data. Using Example 2 above, we can add a filter to the downstream pivot table to filter 'Count of Origin >= 365' so that we only count unique routes that have at least one flight per day. This gives us a better sense of how many regular routes each carrier operates and is an example of a Calculate > Filter > Calculate workflow. 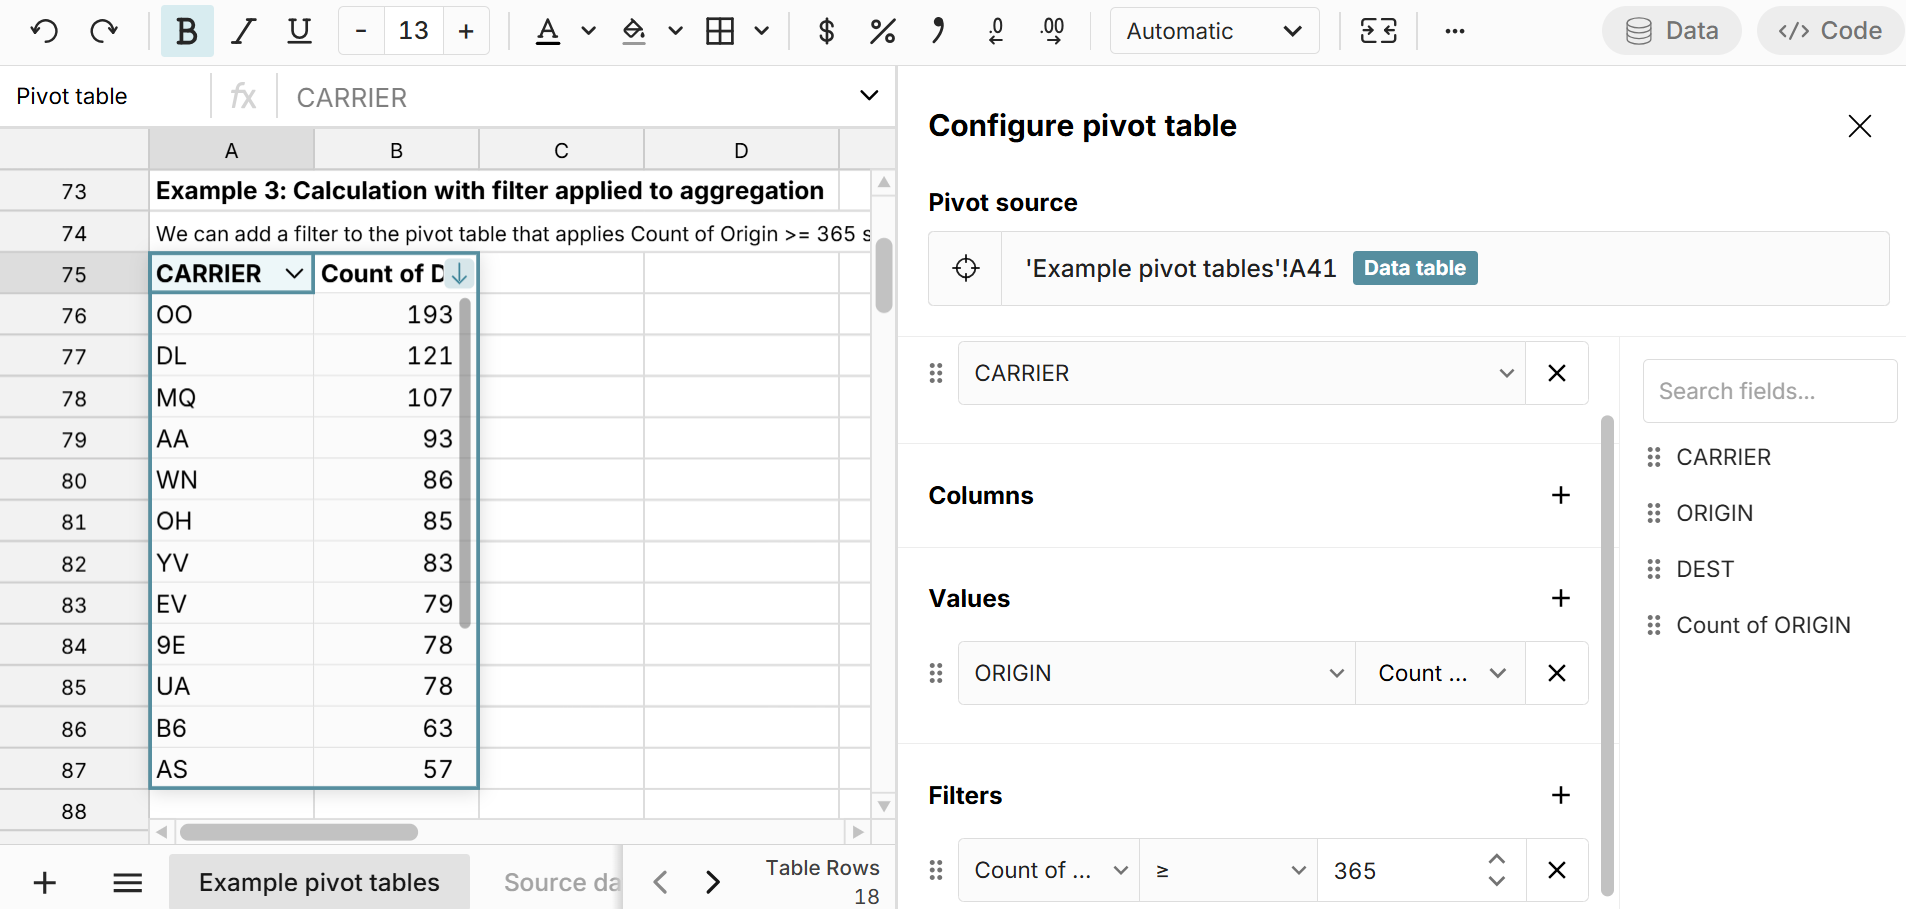
4. Join pivot tables to look at filtered rates
We can take this same pivot table of daily routes and use XLOOKUP in a calculated column to easily join the filtered and unfiltered pivot tables and add calculated columns for % of routes daily and number of non-daily routes. 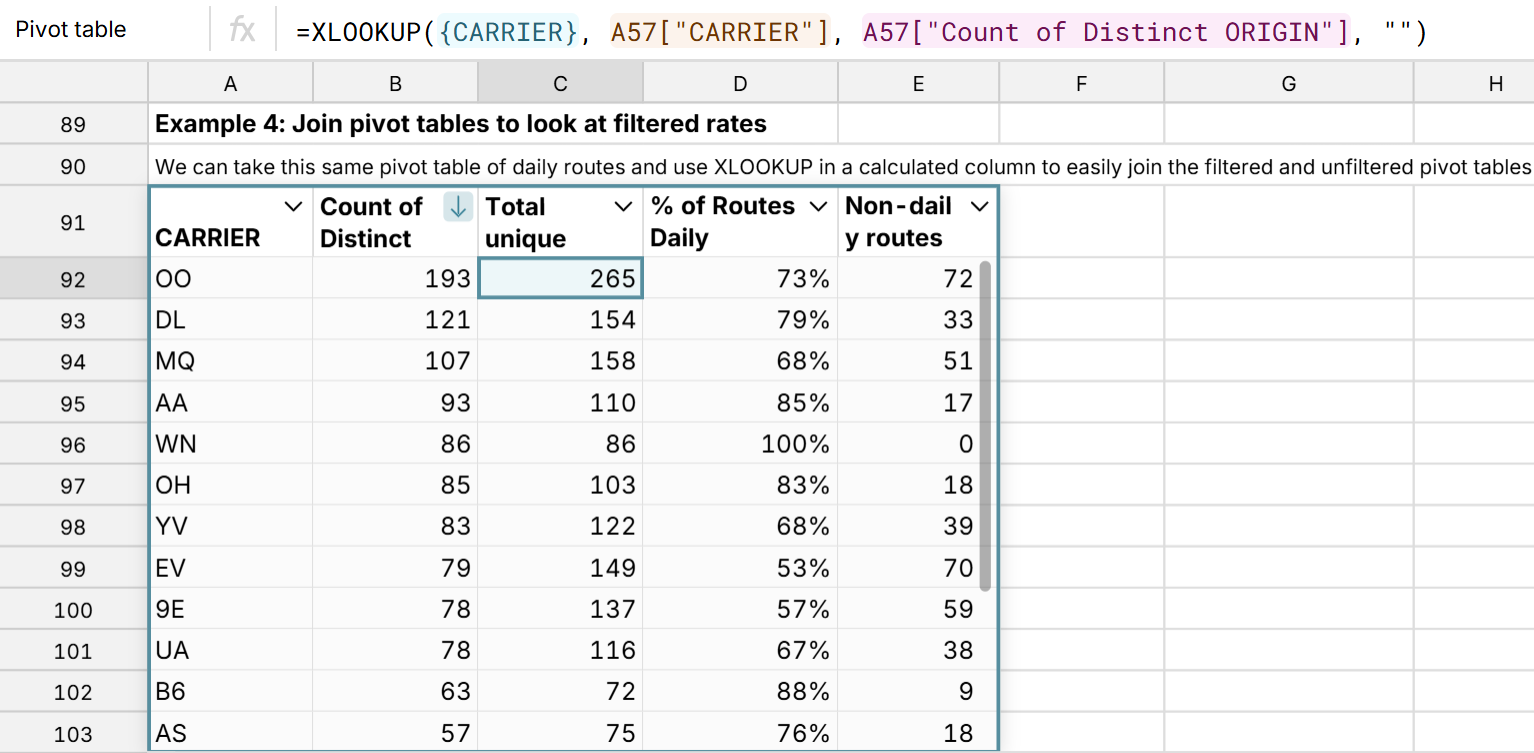
5. Calculated columns - Add a calculated column to your first pivot table and pivot again
Row Zero makes it easy to add calculated columns to a pivot table, so you can add a calculated column to your first pivot table and then pivot again to include the calculated column as a field in your downstream pivot table. We can take the first pivot table from Example 2 above and add the 'Cancelled' field to Values and select Sum as the calculation to expand the pivot table, and then add a calculated column for 'Cancel Rate' by adding a formula that divides 'Sum of Cancelled' by 'Count of Origin' (total flights). 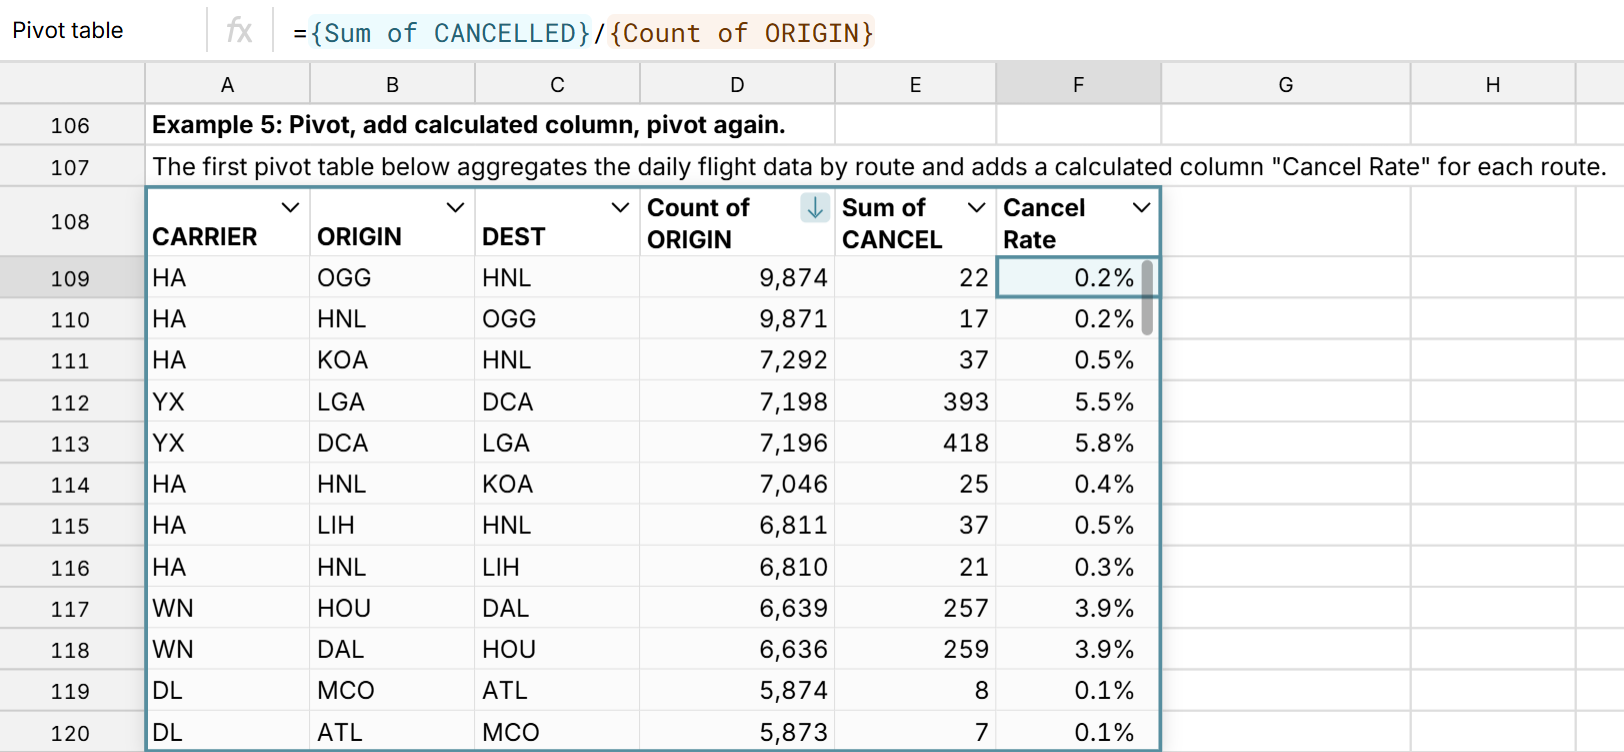
When we pivot this pivot table, the calculated column is an available field to include in the new pivot table. For this next pivot table, we look at the distribution of cancel rates by airport, including Min, 10th percentile, median, 90th percentile, and max. 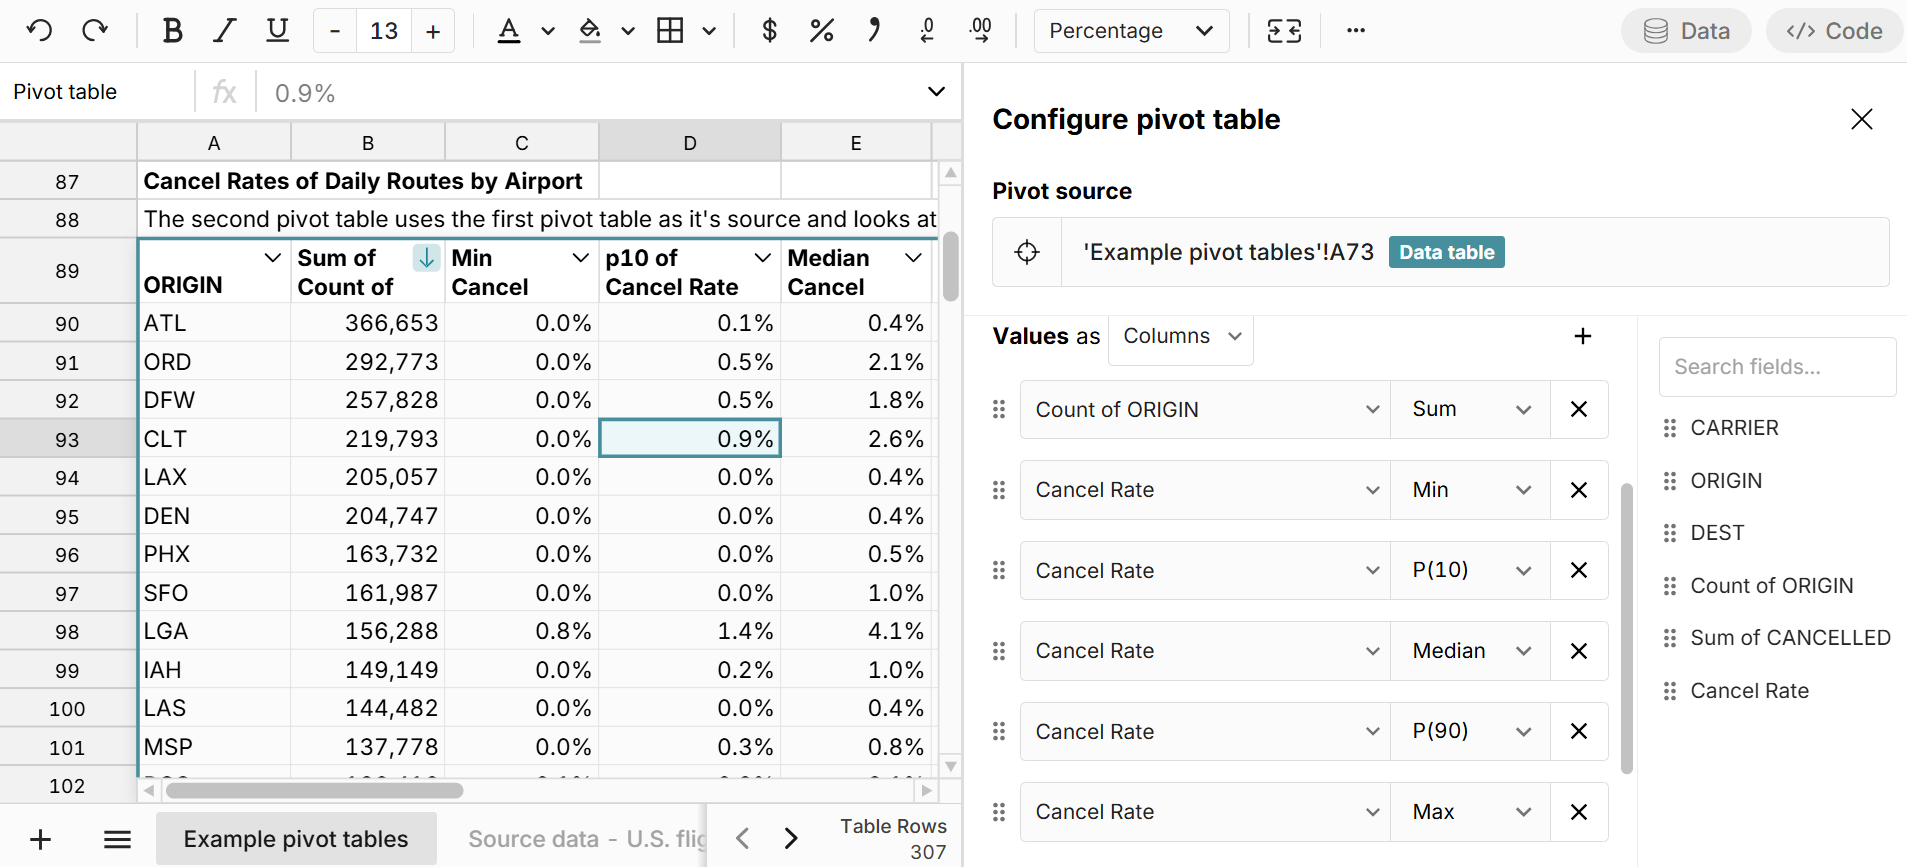
6. Clean data with pivot table 1 and pivot further for analysis
As shown in the examples above, you can use your first pivot table to clean or aggregate your dataset and then re-pivot the cleaned data. For example, pivot tables automatically remove duplicates and can include filters, computed columns, and other calculations that can be used to clean and prep your data for deeper analysis with a downstream pivot table.
7. Automating analysis across multiple pivot tables
You can connect Row Zero spreadsheets directly to your data warehouse to dynamically import data and build connected spreadsheets that auto-update with new data. When building out connected spreadsheets, it's sometimes convenient to use pivot tables to clean or stage data as scaffolding for deeper analysis. This is where it's very helpful to create pivot tables from pivot tables that dynamically update in sync with new data.
How to duplicate a pivot table
Sometimes it's better to duplicate your pivot table and apply different calculations or filters than pivot your pivot table. Copying a a pivot table in Row Zero is very easy. You have two options:
- Right-click on the pivot table and select "Copy table' and then paste with Ctrl + V wherever you'd like.
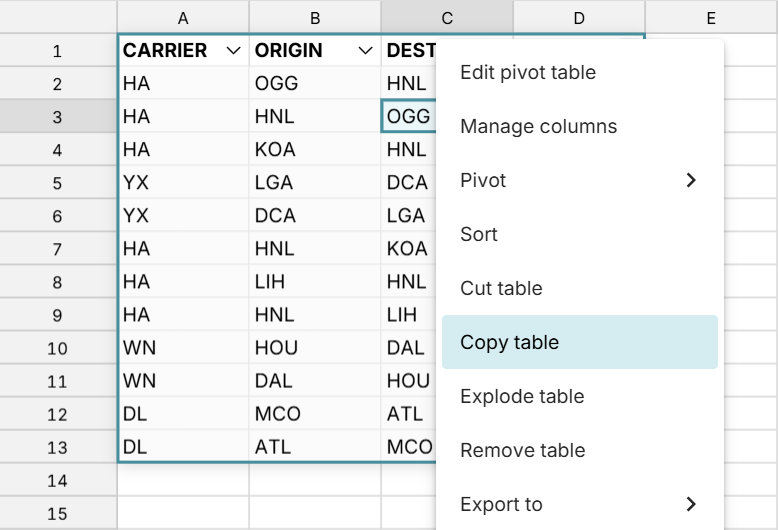
- Click a cell in the pivot table and hit Ctrl + A to select all and then Ctrl + C to copy and Ctrl + V to paste.
You can also cut and paste pivot tables using the same steps.
Conclusion
Row Zero makes it easy to build pivot tables on pivot tables. Simply right-click on your pivot table and select 'Pivot' to create another pivot table using your current pivot table as its source. The cascaded pivot table will update dynamically in sync with the source pivot table.
It can be a challenge to create a pivot table from a pivot table in Excel and Google Sheets. You can copy and paste values from the first pivot table to use as a source for your second pivot table, but the process is static and a clunky way to pivot a pivot. Excel also has a GETPIVOTDATA formula and Power Pivot / Data Model as options to further pivot a pivot table, but they're more complicated for a typical user.
Row Zero pivot tables are dynamic by default and offer several unique advantages including the ability to pivot massive datasets, robust slicers, connectivity to a data source, and unique calculations like date aggregation, count unique, and percentiles. You can view live examples of pivot tables from pivot tables in a spreadsheet here or try Row Zero for free to create your own pivot tables from pivot tables.