Explore comprehensive employment and wage data by location and industry in a big spreadsheet. The spreadsheet includes the full Quarterly Census of Employment and Wages (QCEW) dataset from the U.S. Bureau of Labor Statistics for 2024. Explore for free in Row Zero, an enterprise-grade spreadsheet built for big data that easily opens large QCEW files.
Dataset Summary
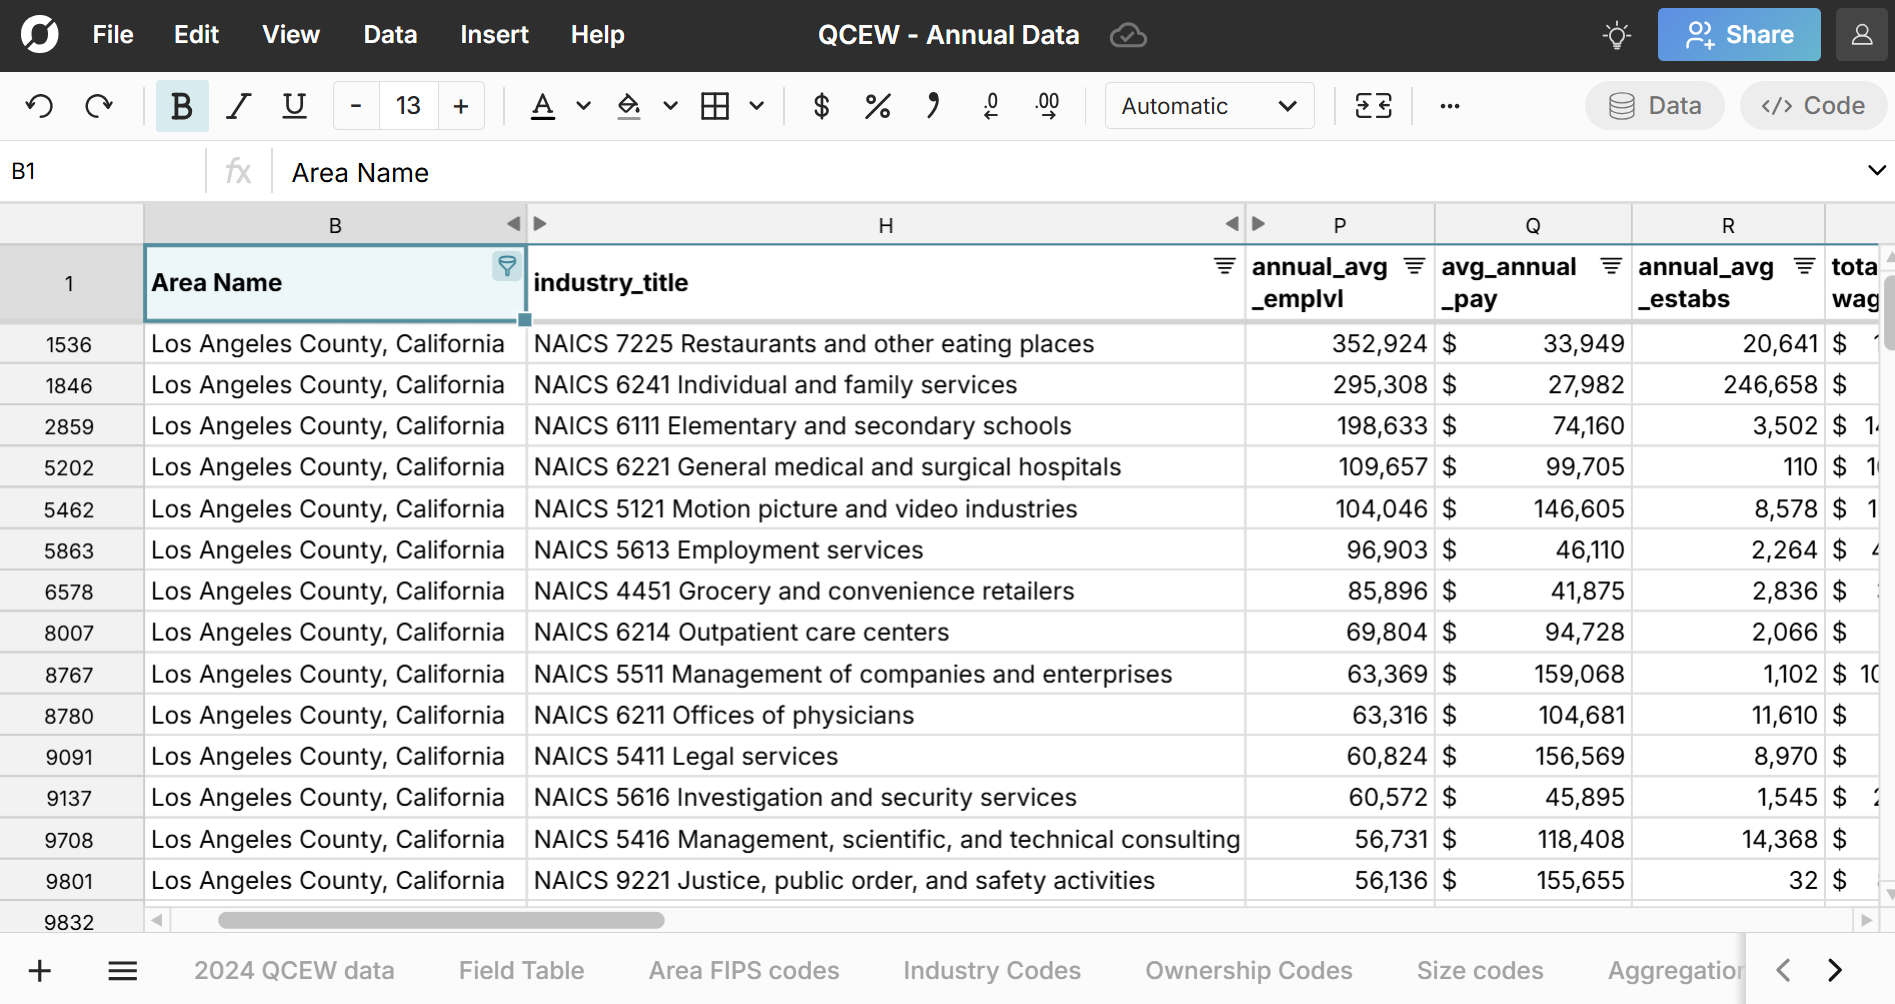
The QCEW spreadsheet includes the full Quarterly Census of Employment and Wages (QCEW) dataset for 2024 and is enriched to map FIPS codes to location names and NAICS industry codes to industry names . You can download the QCEW datasets from the Bureau of Labor Statistics and open in Row Zero. While the files are large, Row Zero makes it easy to open and analyze the QCEW data in a big spreadsheet. The dataset includes the following fields:
- Location data (e.g. Pittsburgh, PA)
- NAICS industry data (e.g. Construction, NAICS code 23 )
- Ownership type (e.g. private, federal government, state government, local government)
- Total Establishments (e.g. breweries, golf courses, or accounting firms)
- Total Employment (e.g. 67,610) - total employment for each industry and location combination
- Location quotients - ratios for how the employment and wages of a given location compared to the U.S. overall. For example, an industry that makes up 10 percent of employment in a specific county compared to 2 percent of U.S. employment would have a location quotient of 5 for that county.
- Total wages - total wages for each industry and location combination.
- Average annual pay - average annual pay for each location and industry combination
- Over-the-year (OTY) change - raw and percentage changes in employment and wages for each location and industry combination
You can easily use the spreadsheet filters to see the number of establishments, wage data, or employment levels by location, industry, size of company, ownership type, or any combination of those things. For example, you can compare wages and employment levels in law firms in New York City vs Los Angeles, large firms vs small firms, or government vs private sector.
Note that some fields are not available at certain filter levels, likely due to low sample sizes or no employment for that combination. These typically are indicated with a "N" in the "disclosure_code" column and will show up as a "0" in most fields.
Highlights from the Dataset:
- Counties with the highest pay
- Best paying industries
- Worst paying industries
- Industries that employ the most
- Cities with the most breweries per capita
- Cities with the most wineries per capita
Counties with highest pay
You can sort the QCEW spreadsheet on average annual pay and filter to "County" for area type to see the counties that pay the most in terms of average annual pay. Santa Clara County, CA is the county with the highest annual pay with an average of $197,181. San Mateo County, CA, San Francisco County, CA, New York County, NY, and King County, WA round out the top 5 highest paying counties. The list below filters to counties with at least 20,000 employed. 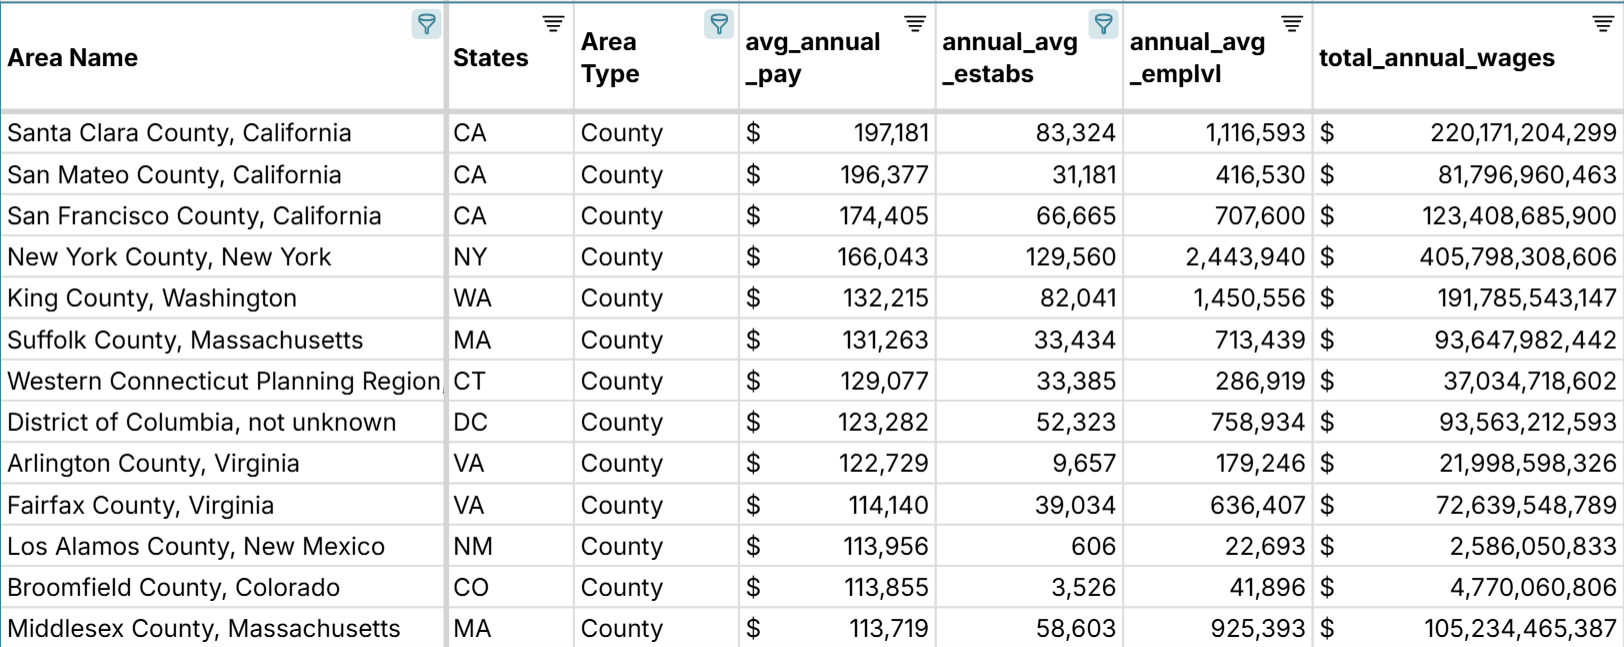
Best paying industries
You can sort on average annual pay and filter agglvl_code to 18 (to get specific industries) to see the industries that pay the most in terms of average annual pay. The best paying industries are in financial services, technology, and oil. The list below filters to industries with at least 10,000 employed. 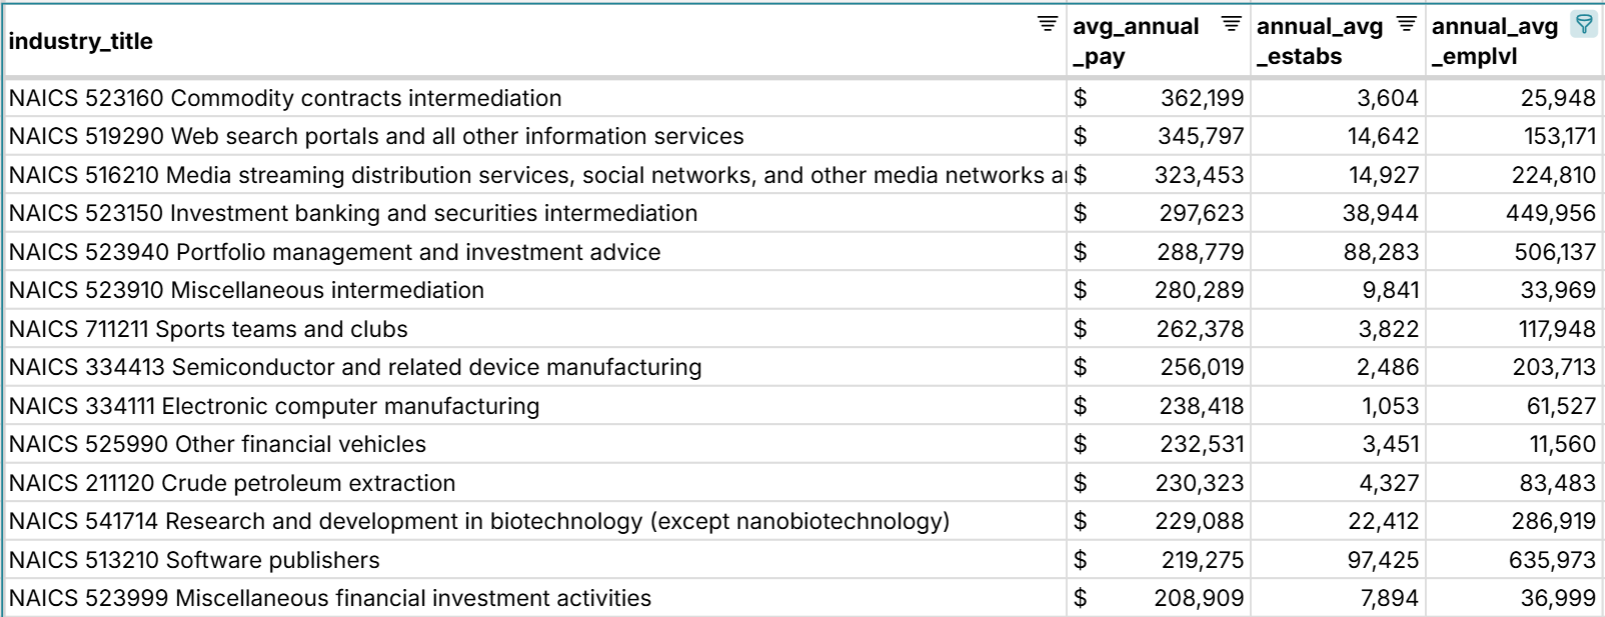
Wort paying industries
Reverse the sort on the view above to get the lowest paying industries. The worst paying industries are in all in the retail and service industries The list below filters to industries with at least 10,000 employed. 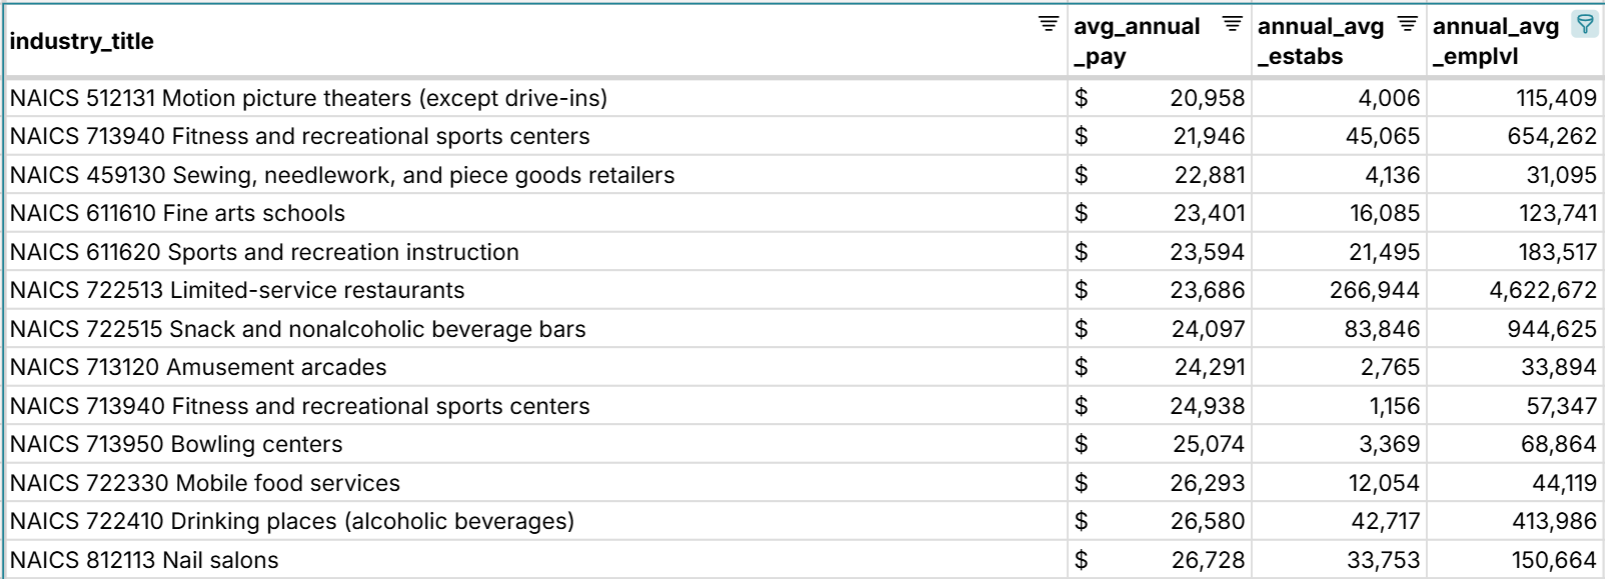
Industries that employ the most
Sorting on annual_avg_emplvl and filtering to industry level 17 (agglvl_code 17) for more general categories shows the industries with the most employment. Restaurants employ the most people in the U.S. followed by schools, hospitals, and doctor's offices. 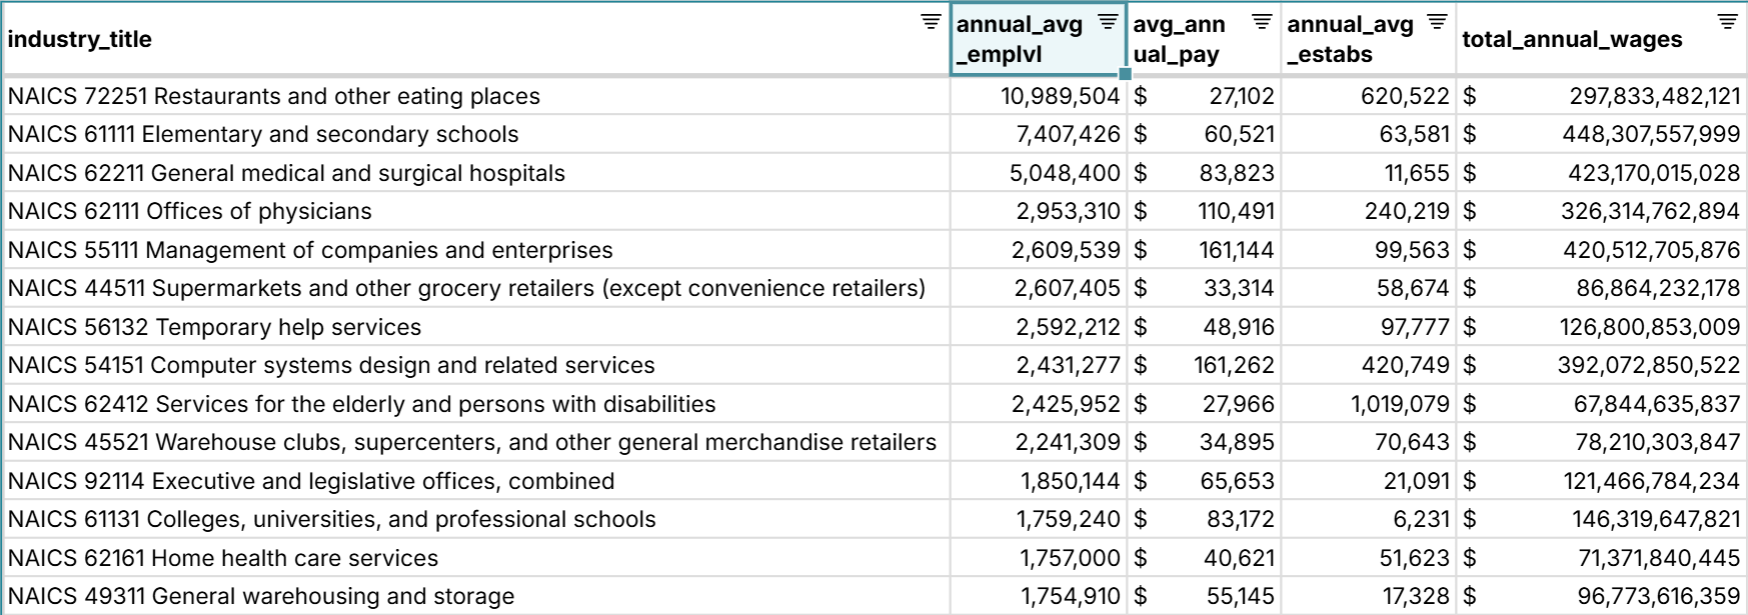
Cities with the most breweries per capita
You can filter and sort the QCEW spreadsheet to see where certain industries are concentrated. While this can help support public policy research, it also can surface insights for tourism and travel. For example, we can find the cities with the most breweries per capita by sorting the location quotient for establishments and filtering to the NAICS code for breweries (31212) and filtering the area type to Metro Areas. This list below also filters to having at least 10 establishments in the location.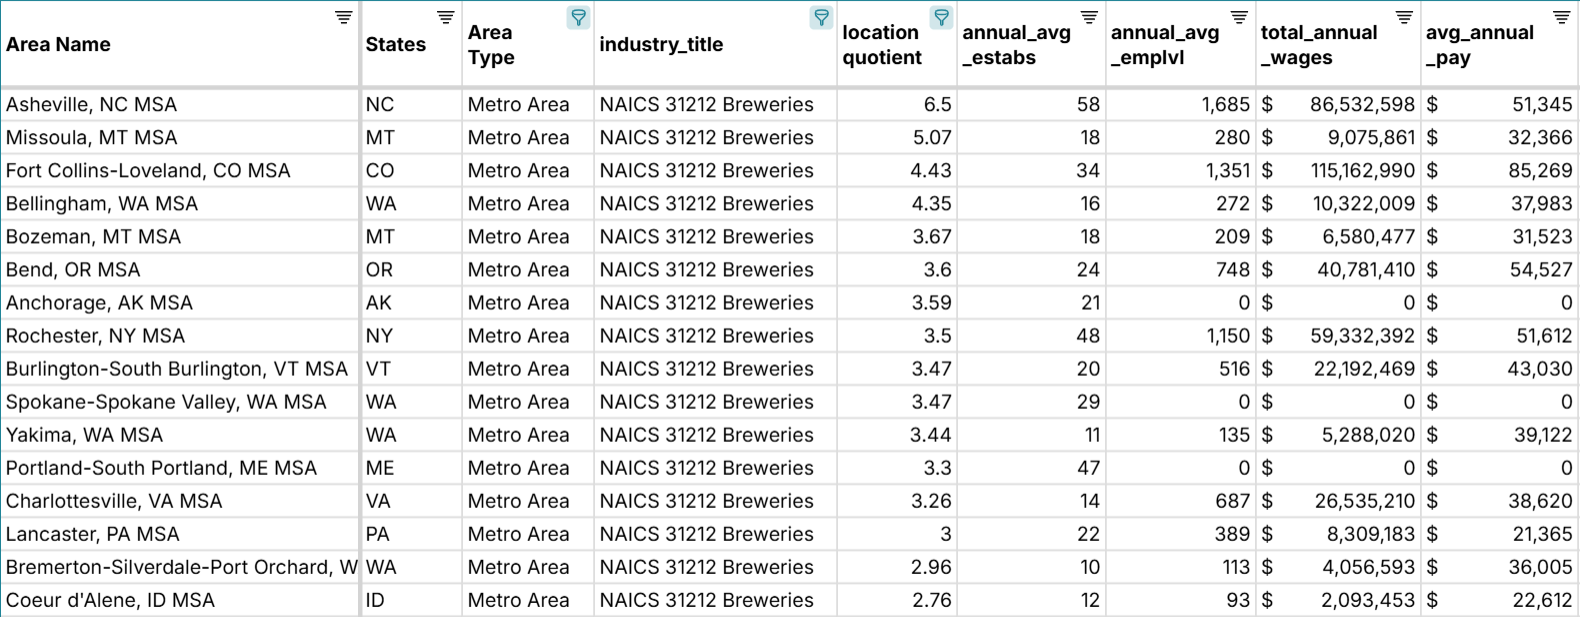 As you can see, the cities with the most breweries per capita are Asheville, NC, Missoula, MT, Fort Collins, CO, Bellingham, WA, Bozeman, MT, and Bend, OR. Fort Collins breweries offer the highest annual pay.
Cities with the most wineries per capita
You can filter and sort the QCEW spreadsheet to see cities with the most wineries per capita by sorting the location quotient for establishments and filtering to the NAICS code for wineries (31213) and filtering the area type to Metro Areas. 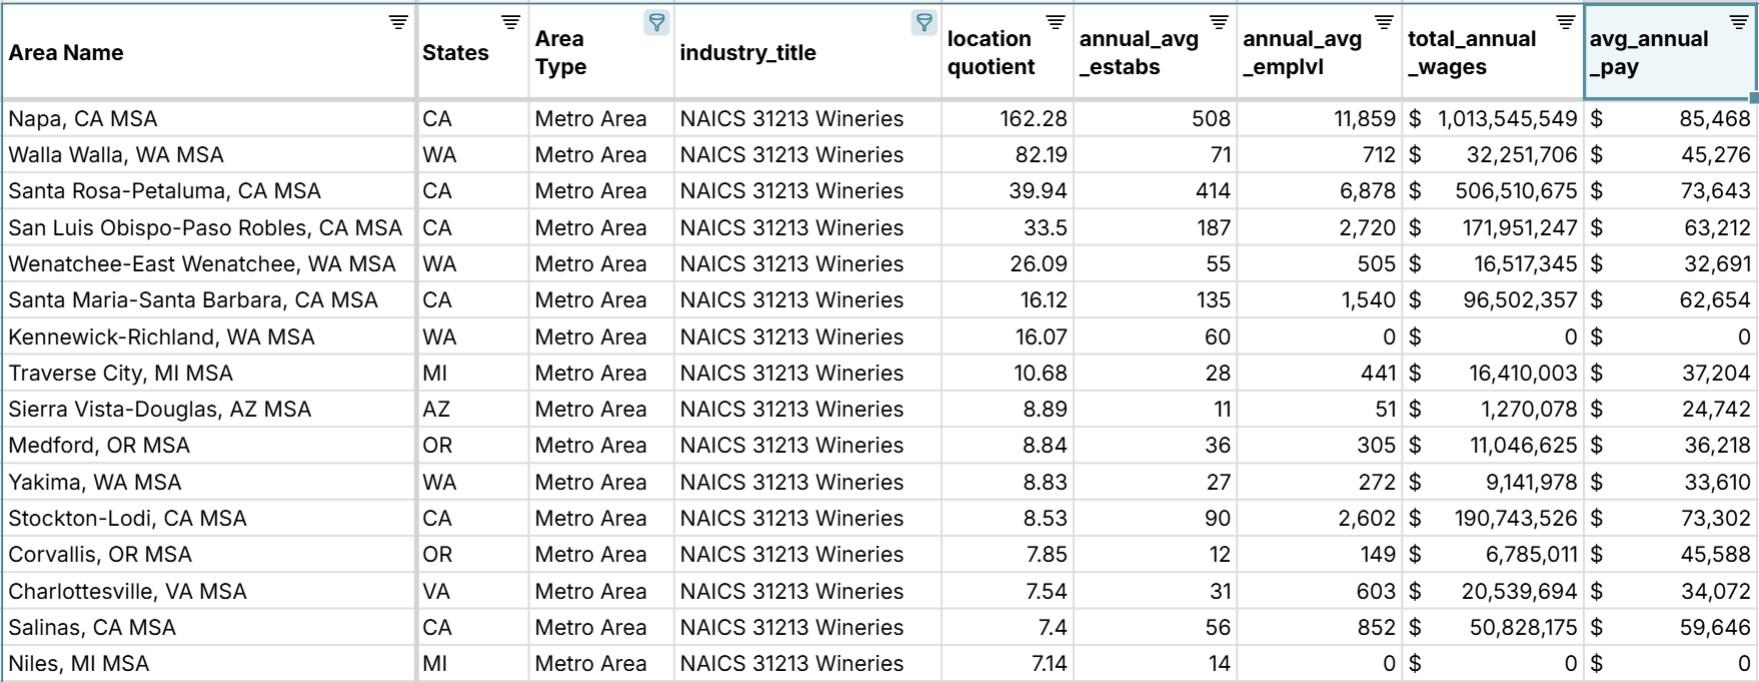 As you can see, the cities with the most wineries per capita are Napa, CA, Walla Walla, WA, Santa Rosa, CA, San Luis Obispo, CA, and Wenatchee, WA. Napa wineries offer the highest annual pay.
Use Cases for this Dataset
Row Zero is a spreadsheet designed for big data, so you can easily open QCEW datasets at both the annual and quarterly level. You also have space to import your data into the QCEW spreadsheet (or vice versa) to map your data or analyze the QCEW data with charts and pivot tables. Here are a few common use cases:
- Lookup employment and wages by industry and location and benchmark compensation for your industry, city, our county or compare wages by location.
- Rank the highest paying industries by state, metro area, or county. You can also rank the highest paying industries and locations across federal, state, and local governments.
- Research a specific industry or location to see where certain industries are concentrated or what industries are important to each state, county, and city. This can be for fun like the examples of most breweries and wineries above or to support public policy research.
- Enrich your current datasets with QCEW data. You can use XLOOKUP to join datasets or import QCEW data directly to your database or data warehouse using Row Zero's data connectors.
- Government transparency - see how many people are employed by the federal government, state governments, and local governments by industry. You can use the dataset to lookup average government employee salaries by location and industry, compare pay differences between public and private sectors, or benchmark wages and employment across state and local governments.
Data Sources
The source for this dataset is the Quarterly Census of Employment and Wages (QCEW) dataset from the Bureau of Labor Statistics. You can download QCEW data from the BLS and open for free in Row Zero at any time. You can download both annual QCEW files and quarterly QCEW files. The QCEW data dictionary can be downloaded here. Data in the spreadsheet has been updated as of July 2025 with the most recent annual data available.