Explore comprehensive employment and salary data in a spreadsheet. View average salary by job by city, state, and industry along with employment numbers and salary ranges. The spreadsheet includes the full Occupational Employment and Wage Statistics (OEWS) dataset from the U.S. Bureau of Labor Statistics for both 2024 and 2019 so you can compare employment changes over the last 5 years and compare salaries before and after COVID. Explore for free in Row Zero, an enterprise-grade spreadsheet built for big data.
Dataset Summary
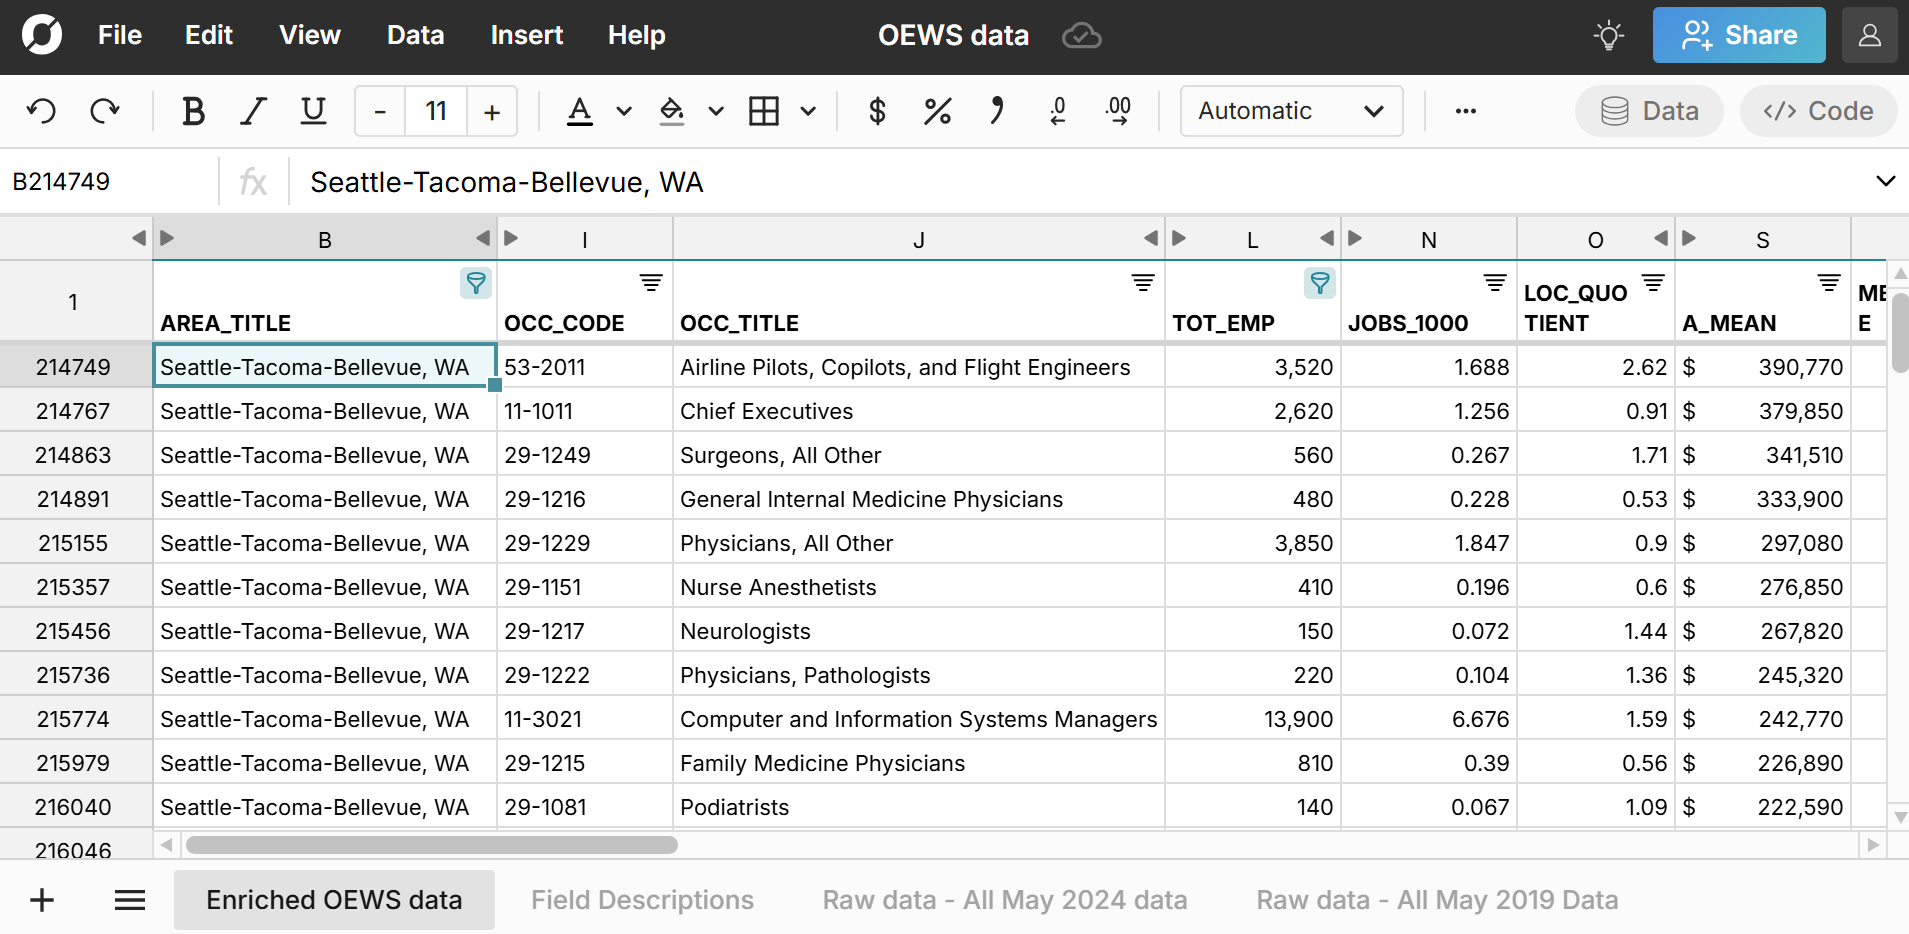
This spreadsheet includes the full Occupational Employment and Wage Statistics (OEWS) dataset for 2024 and 2019 and is enriched to map the changes in employment and wages over the last 5 years to give a view into employment and salary changes before and after COVID. You can download the OEWS datasets from the Bureau of Labor Statistics and open in Row Zero. While the files are large, Row Zero makes it easy to open and analyze the OEWS data in a big spreadsheet. The dataset includes the following fields:
- Location data (e.g. Pittsburgh, PA)
- NAICS industry data (e.g. Construction, NAICS code 23 )
- Ownership type (e.g. private, federal government, state government, local government)
- Occupation codes and names (e.g. Accountant, OCC_Code 12-2010)
- Total Employment (e.g. 67,610)
- Jobs per 1000 - number of jobs in a given occupation per 1,000 jobs in the given area
- Location quotient - the ratio of an occupation’s share of employment in a given area to that occupation’s share of employment in the U.S. overall. For example, a job that makes up 8 percent of employment in a specific metro area compared to 2 percent of U.S. employment would have a location quotient of 4 for that metro area.
- Hourly mean wage
- Annual mean wage
- Hourly wage percentiles - 10th, 25th, median, 75th, 90th
- Annual wage percentiles - 10th, 25th, median, 75th, 90th
You can easily use the spreadsheet filters to see compensation benchmarks by metro area, state, industry, and company type for any occupation. For example, you can compare Accountant salaries in Boston vs Philadelphia, construction vs real estate, or government vs private sector.
Note that some fields are not available at certain filter levels, likely due to low sample sizes. These are indicated with a "*" or blank. A "#" symbol indicates a wage equal to or greater than $115 per hour or $239,200 per year, although some mean values are included greater than these levels. Also note the OEWS release does not include data for Colorado and its areas. To view wage data by county, view the QCEW dataset.
Highlights from the Dataset:
- Highest paying jobs in the U.S.
- Highest paying jobs in the federal government
- States with the highest salaries
- Metros with the highest salaries
- Fastest growing jobs in last 5 years
- Biggest job declines in the last 5 years
- Jobs with biggest pay increase in last 5 years
Highest paying jobs
You can filter and sort the OEWS spreadsheet to see the highest paying jobs in the U.S. Pediatric Surgeons are the highest paid jobs with an average annual salary of $450,810 in the OEWS data. Cardiologists, Orthopedic Surgeons, Oral and Maxillofacial Surgeons, and Radiologists round out the top 5 best paying jobs in America. 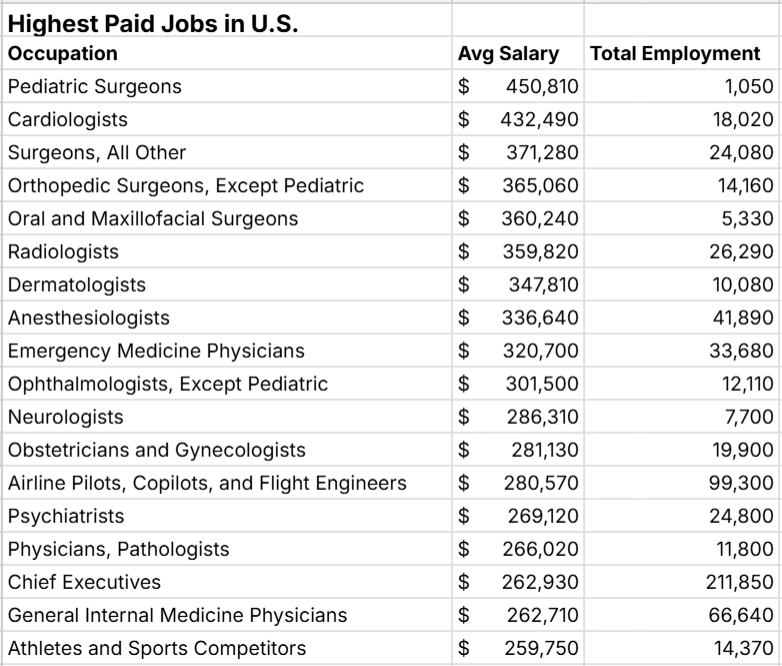 To see the highest paying jobs in the spreadsheet, apply the following filters: Area_Title = U.S., NAICS_Title = Cross-industry, O_Group = detailed and then sort on A_Mean (Average annual salary). You can also easily filter the spreadsheet to see highest paying jobs by state, metro, industry, etc.
Highest paying jobs in the federal government
You can filter the highest paying jobs list above to view the highest paying jobs in the federal government. Just filter the column NAICS_TITLE to "Federal Government, including postal service". 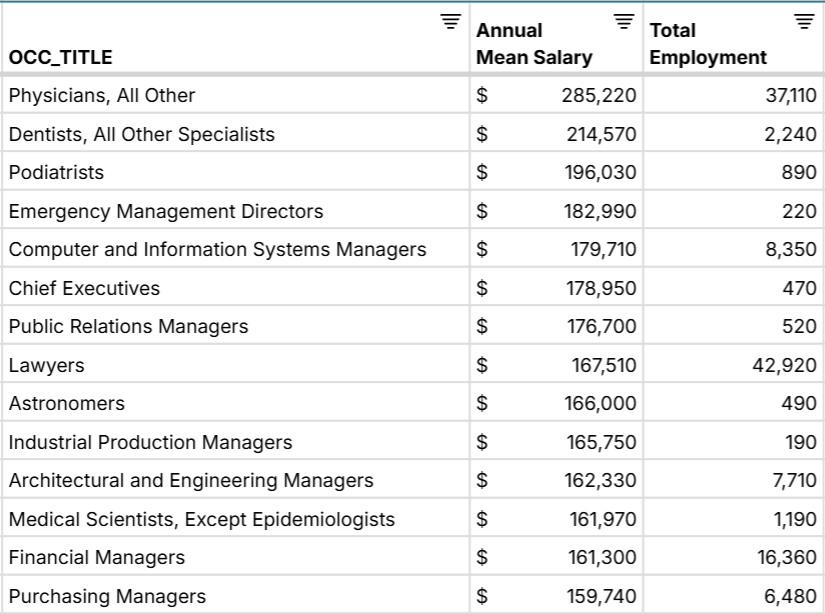 The 5 highest paying federal government jobs are Physicians, Dentists, Podiatrists, Emergency Management Directors, and Computer and Information Systems Managers. You can also filter the same field to see the highest paying jobs in the federal executive branch as well as highest paying jobs in state and local governments.
States with the highest salaries
Filtering the OEWS data to "All Occupations" for OCC_TITLE and "2" for Area _Type shows the average annual salary by state, which you can sort to see the states with the highest salaries. DC is by far the highest with a mean salary of $109,420, although not technically a state. Massachusetts, Washington, New York, California, and New Jersey are the top 5 highest paying states. 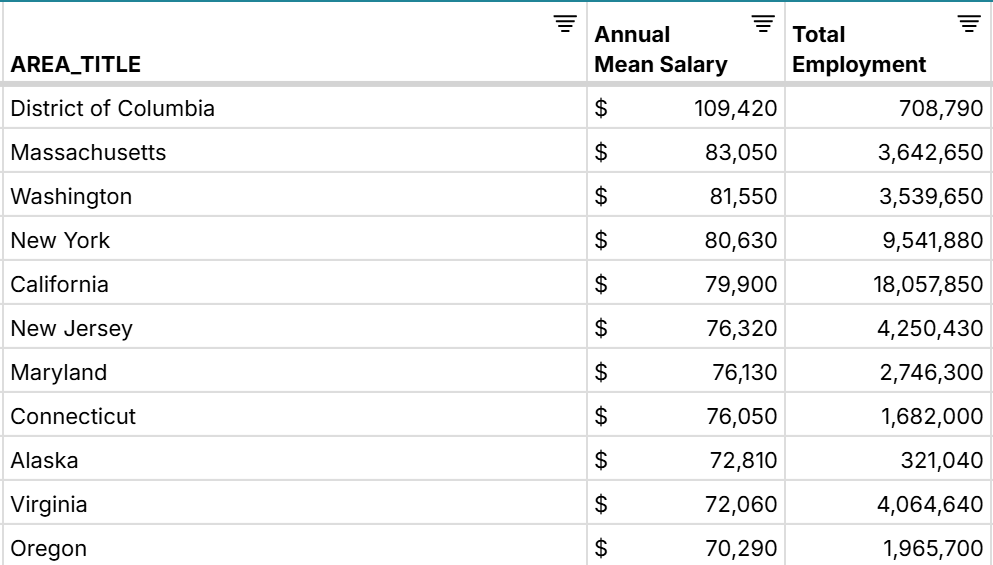
Metro Areas with the highest salaries
You can similarly fitler Area_Type to "4" to see the average annual salary by metro area, which you can sort to see the metro areas with the highest salaries. The San Jose-Sunnyvale-Santa Clara metro area (aka Silicon Valley) is by far the highest paying metro area with an average mean salary of $121,160. San Francisco, Washington, D.C., Seattle, Boston, and New York are the next highest paying cities. 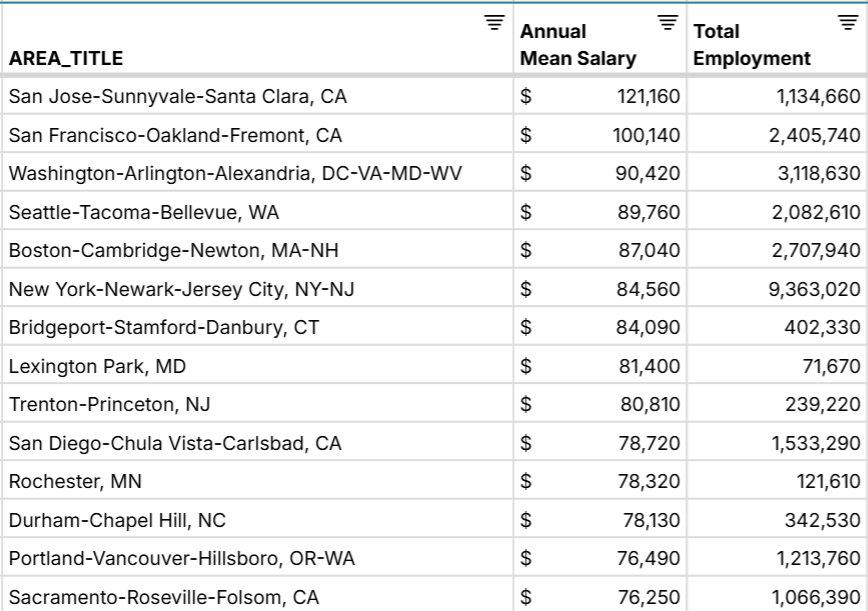
Fastest growing jobs in last 5 years
Filter and sort the spreadsheet to see the fastest growing jobs in the U.S. by percentage growth since 2019. Solar Photovoltaic Installers are the fastest growing jobs in the OEWS data, growing 155% over the last 5 years. Models, Wind Turbine Service Technicians, Entertainment Attendants, and Psychiatric Technicians round out the top 5 fastest growing jobs in America. 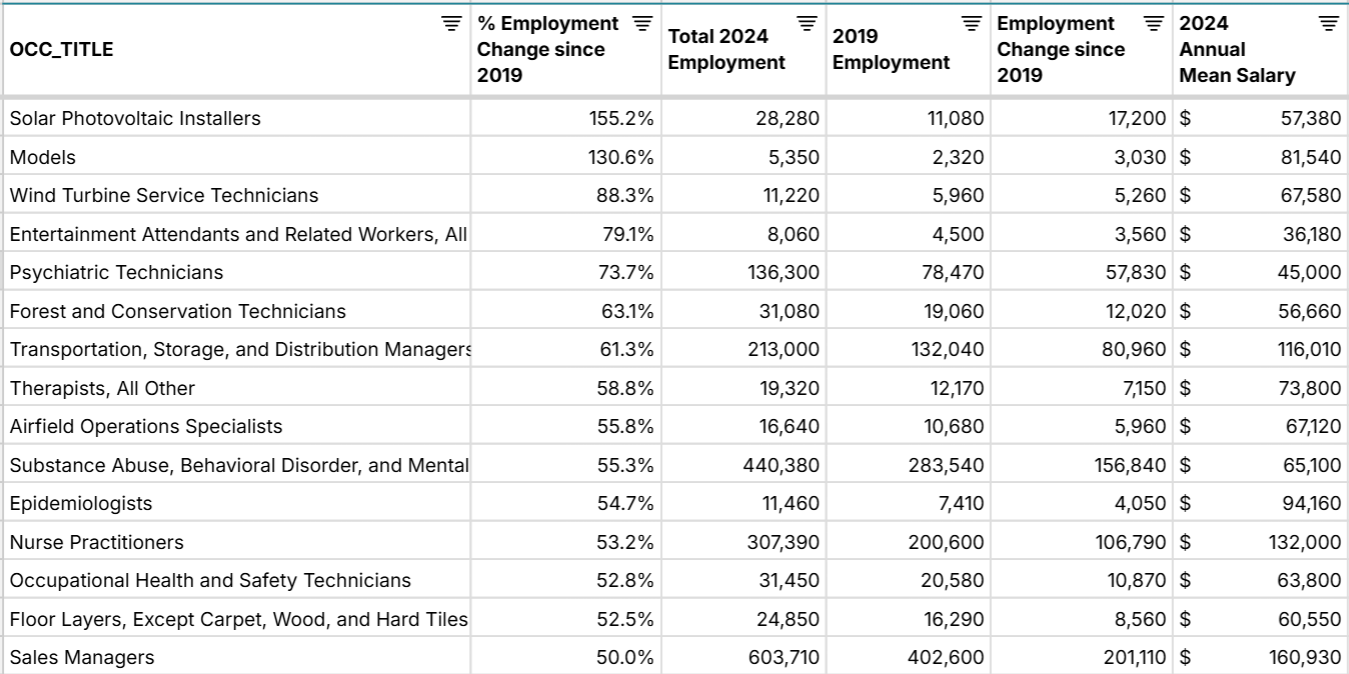
Biggest job declines in last 5 years
The COVID pandemic caused significant job losses across many industries. While employment has recovered in most industries, several occupations are still below pre-COVID levels, particularly in retail and service industries. The biggest job losses since COVID are for Retail Salespersons, Cashiers, Office Clerks, Secretaries and Administrative Assistants, and Waiters and Waitresses with all still more than 250,000 fewer people employed since 2019. 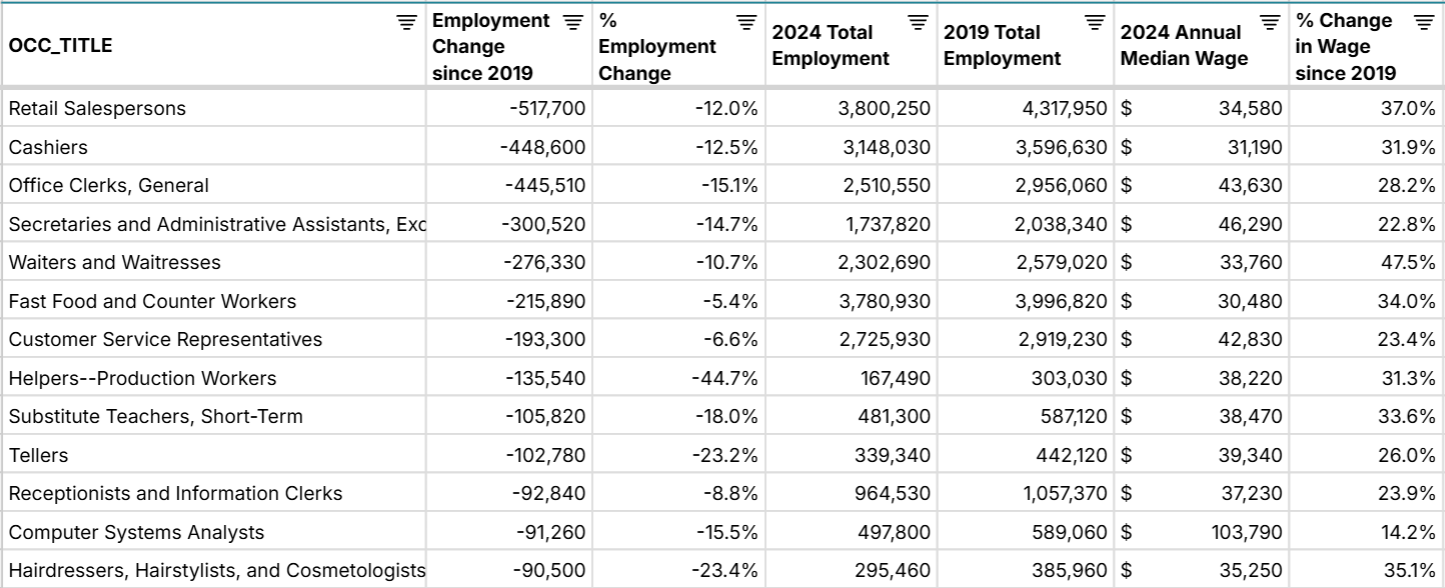
Jobs with biggest pay increase in last 5 years
While there has been strong wage increases across industries over the last 5 years, many jobs have experienced big pay increases. Gambling Dealers saw the biggest increase in median pay over the last 5 years, growing 56.5%. Pilots, Legislators, and Transportation Security Screeners also saw salary increases over 50%. 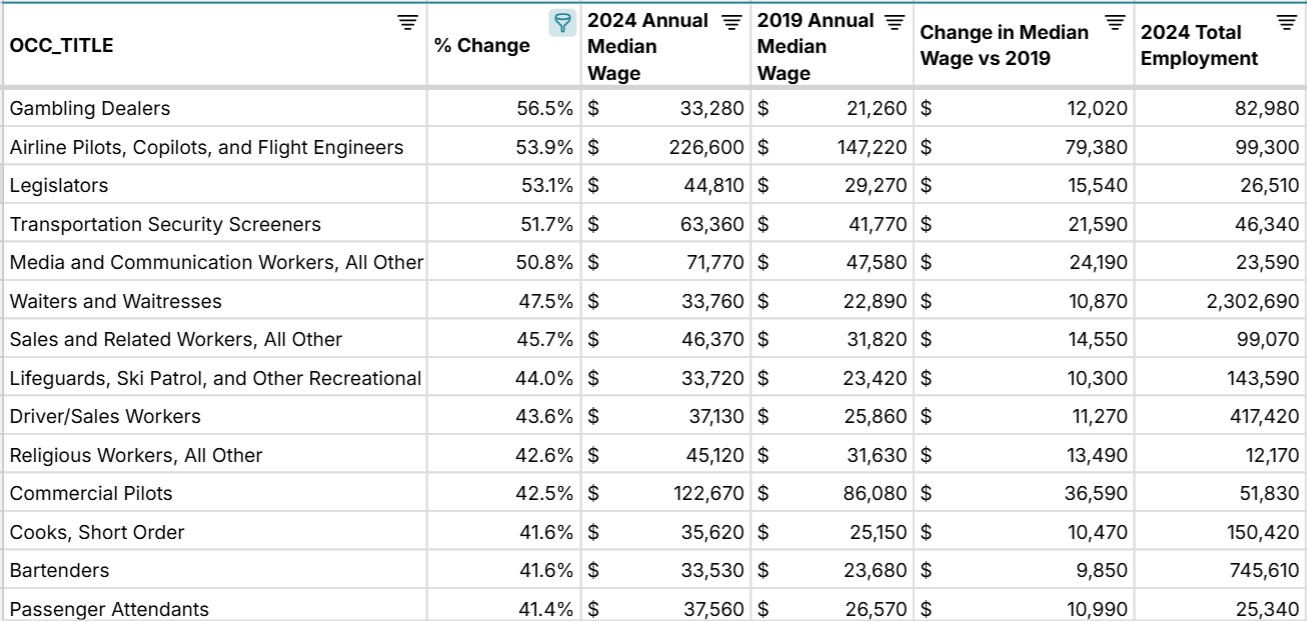
Use Cases for this Dataset
Row Zero is a spreadsheet built for big data, so you can easily import your data into the OEWS spreadsheet (or vice versa) to map your data or analyze the OEWS data with charts and pivot tables. Here are a few common use cases:
- Lookup salaries by job, state, city, or industry and find relevant compensation benchmarks to see if you are underpaid or overpaid compared to your peers.
- Rank the highest paying jobs by state, metro area, or industry. You can also rank the highest paying government jobs across federal, state, and local governments.
- Enrich your current datasets with OEWS data. You can use XLOOKUP to join datasets or import OEWS data directly to your database or data warehouse using Row Zero's data connectors.
- Benchmark salaries by job and location. HR and Finance teams often use compensation benchmarks like the OWES data to determine salary ranges by job for their employees. Since the full OEWS database fits in the spreadsheet, anyone can easily see aggregate pay transparency data by job, state, metro, and industry.
- Government transparency - see how many people are employed by the federal government, state governments, and local governments by occupation. You can use the dataset to lookup federal employee salaries by job, compare salary differences between public and private sectors, or benchmark salaries and employment across state governments.
Data Sources
The source for this dataset is the Occupational Employment and Wage Statistics (OEWS) dataset from the Bureau of Labor Statistics. You can download OEWS data from the BLS and open for free in Row Zero at any time. Data in the spreadsheet has been updated as of July 2025 with the most recent data available.