This dataset provides a comprehensive list of all metropolitan statistical areas and micropolitan statistical areas in the U.S. View income, population, and demographics by metropolitan statistical area, CSBA codes, and mappings of ZIP code to metro area, town to metro area, and metro area to state. Explore for free in Row Zero, a next-gen spreadsheet built for big data.
Dataset Summary
 This dataset includes comprehensive demographics, income, and population change for each core-based statistical area including 393 metropolitan statistical areas and 542 micropolitan statistical areas. The spreadsheet includes several different sheets of U.S. Census Data by metro area, including:
- Demographics by Metro Area
- Income by Metro Area
- Population Change by Metro Area
- Map Metro to ZIP code
- Map ZIP to Metro Area and State
- Map Town to Metro
- Map County to Metro
- Map Metro to State
- Overall U.S. Demographics and Income
Metropolitan statistical areas vs micropolitan statistical areas
What is a metropolitan statistical area?
A metropolitan statistical area (or metro area) is a geographic location with at least one urbanized area with a population of 50,000 or more and includes the surrounding counties that have strong economic and social ties to core urban area as measured by commuting patterns. Metro Areas are defined by the U.S. Office of Management and Budget (OMB).
What is a micropolitan statistical area?
Similar to metro areas, a micropolitan statistical area (or micro area) is a geographic location with at least one urbanized core and surrounding communities. The urbanized core of micro areas has a population between 10,000 and 50,000, but the total population, including surrounding areas, can be higher.
Difference between metropolitan statistical areas and micropolitan statistical areas
Both metropolitan statistical areas and micropolitan statistical areas are U.S. geographic areas called core-based statistical areas (CBSA) that consist of an urban core and surrounding communities. The main difference between metropolitan statistical areas vs micropolitan statistical areas is population size. The core urban area of metro areas have a population of 50,000 or more whereas the urban core of micro areas have a population between 10,000 and 49,999.
Demographics by Metro Area
The Demographics by Metro Area sheet includes metropolitan statistical area population by age and gender with both raw counts and percentages. 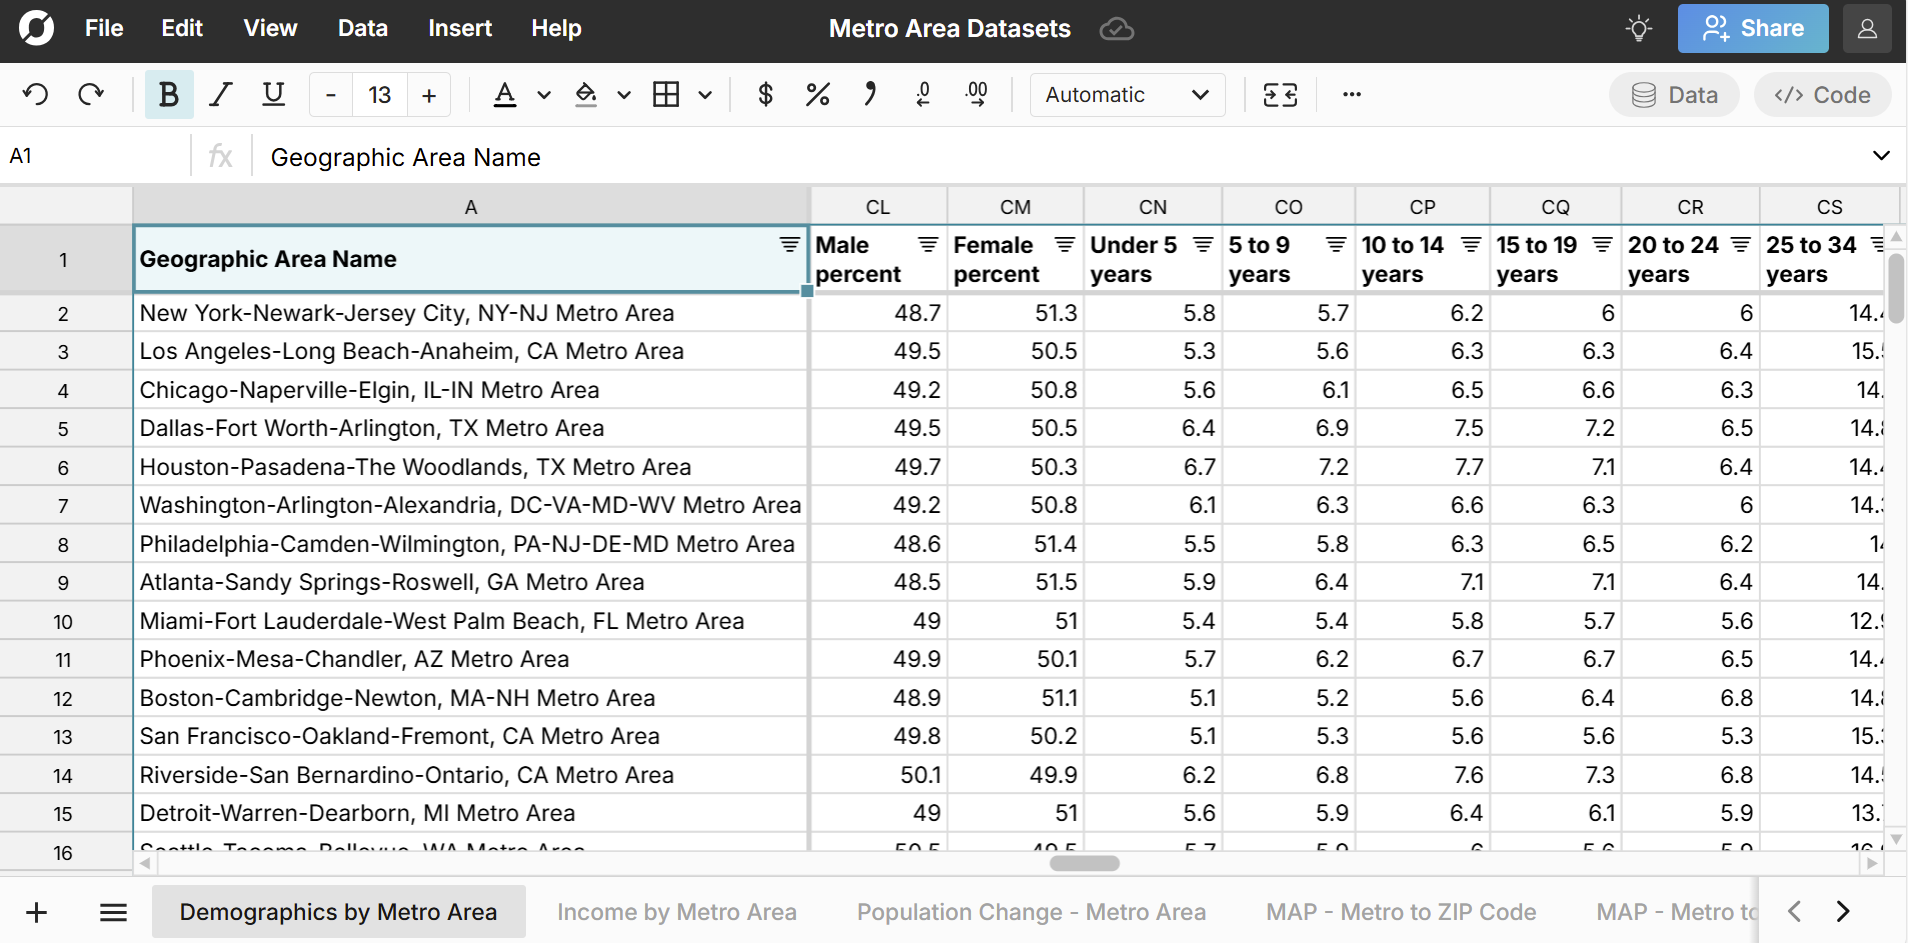
Metropolitan Statistical Area Race Breakdown
The Demographics by Metro sheet also includes race breakdown by metropolitan statistical area with both raw counts and percentage breakdowns for single race and multiracial residents. 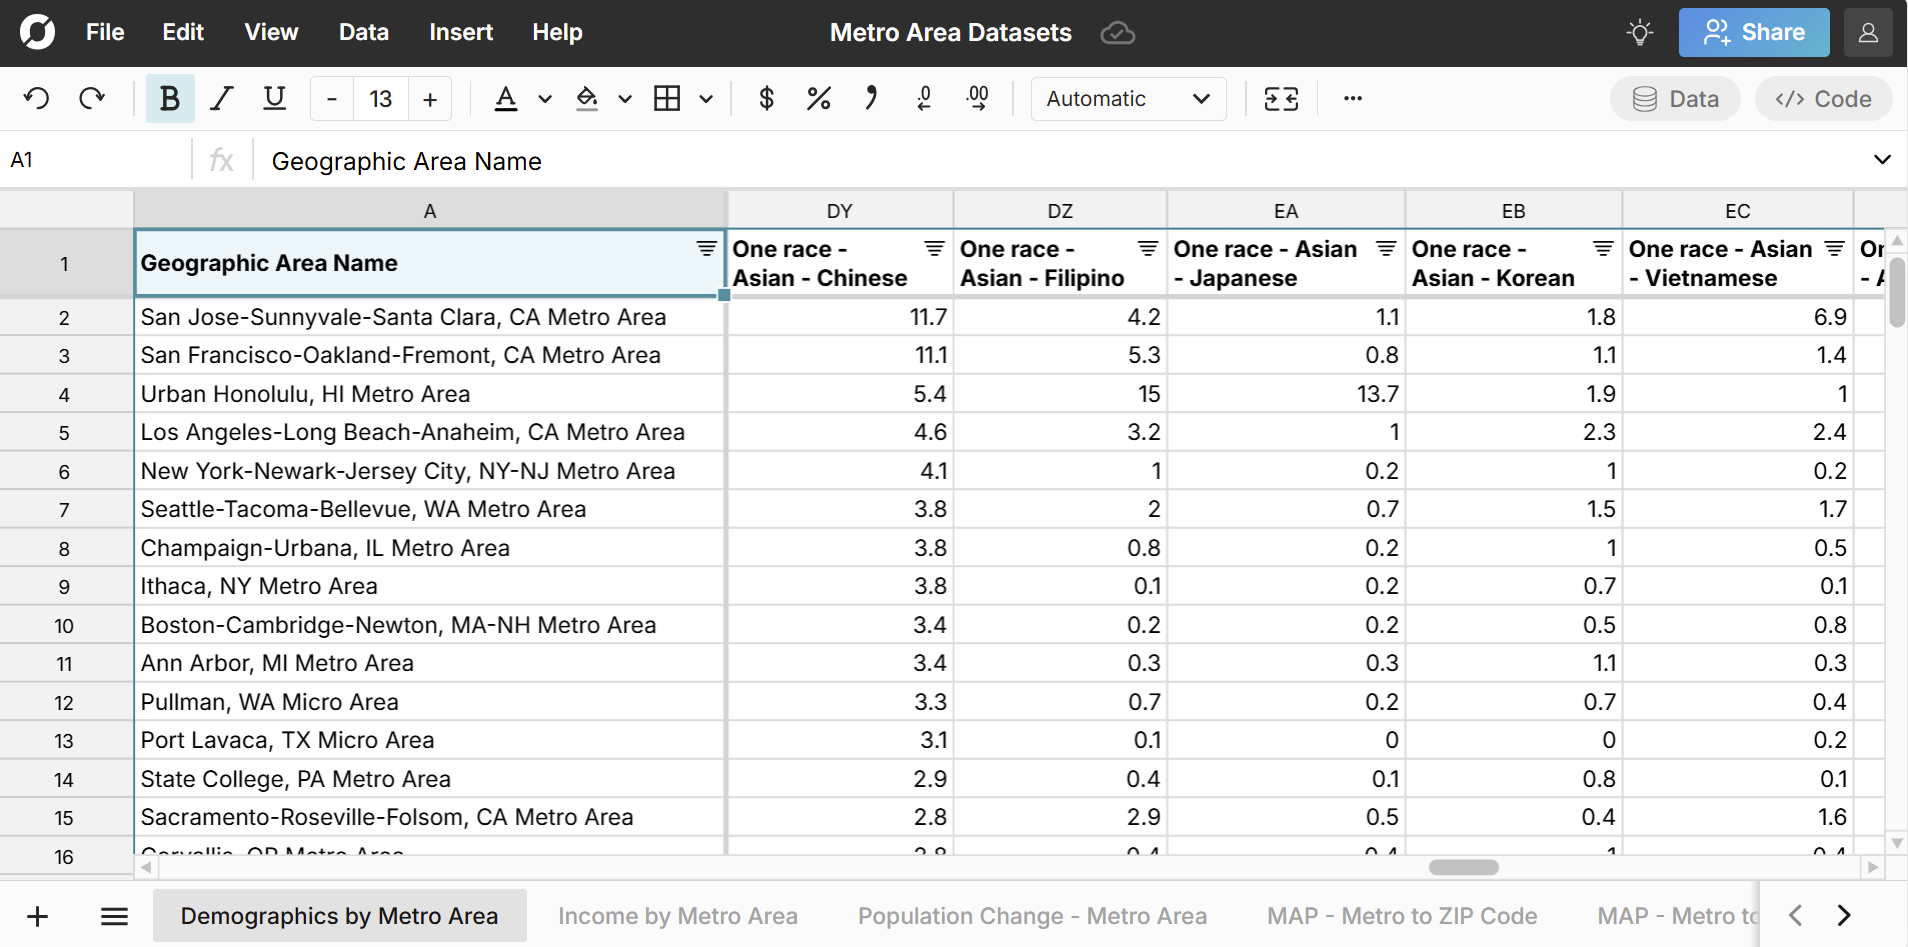 The race breakdown for each metro and micro area includes:
- White
- Black or African American
- American Indian and Alaska Native
- Aztec
- Blackfeet Tribe
- Maya
- Barrow Inupiat
- Navajo Nation
- Nome Eskimo
- Other
- Asian
- Asian Indian
- Chinese
- Filipino
- Japanese
- Korean
- Vietnamese
- Other
- Native Hawaiian and Other Pacific Islander
- Chamorro
- Native Hawaiian
- Samoan
- Other
- Hispanic or Latino (of any race)
- Mexican
- Puerto Rican
- Cuban
- Other
Metropolitan Statistical Area Income Breakdown
The Income by Metro Area sheet includes each metro area's median household income, mean income, and family income by metro and micro area. 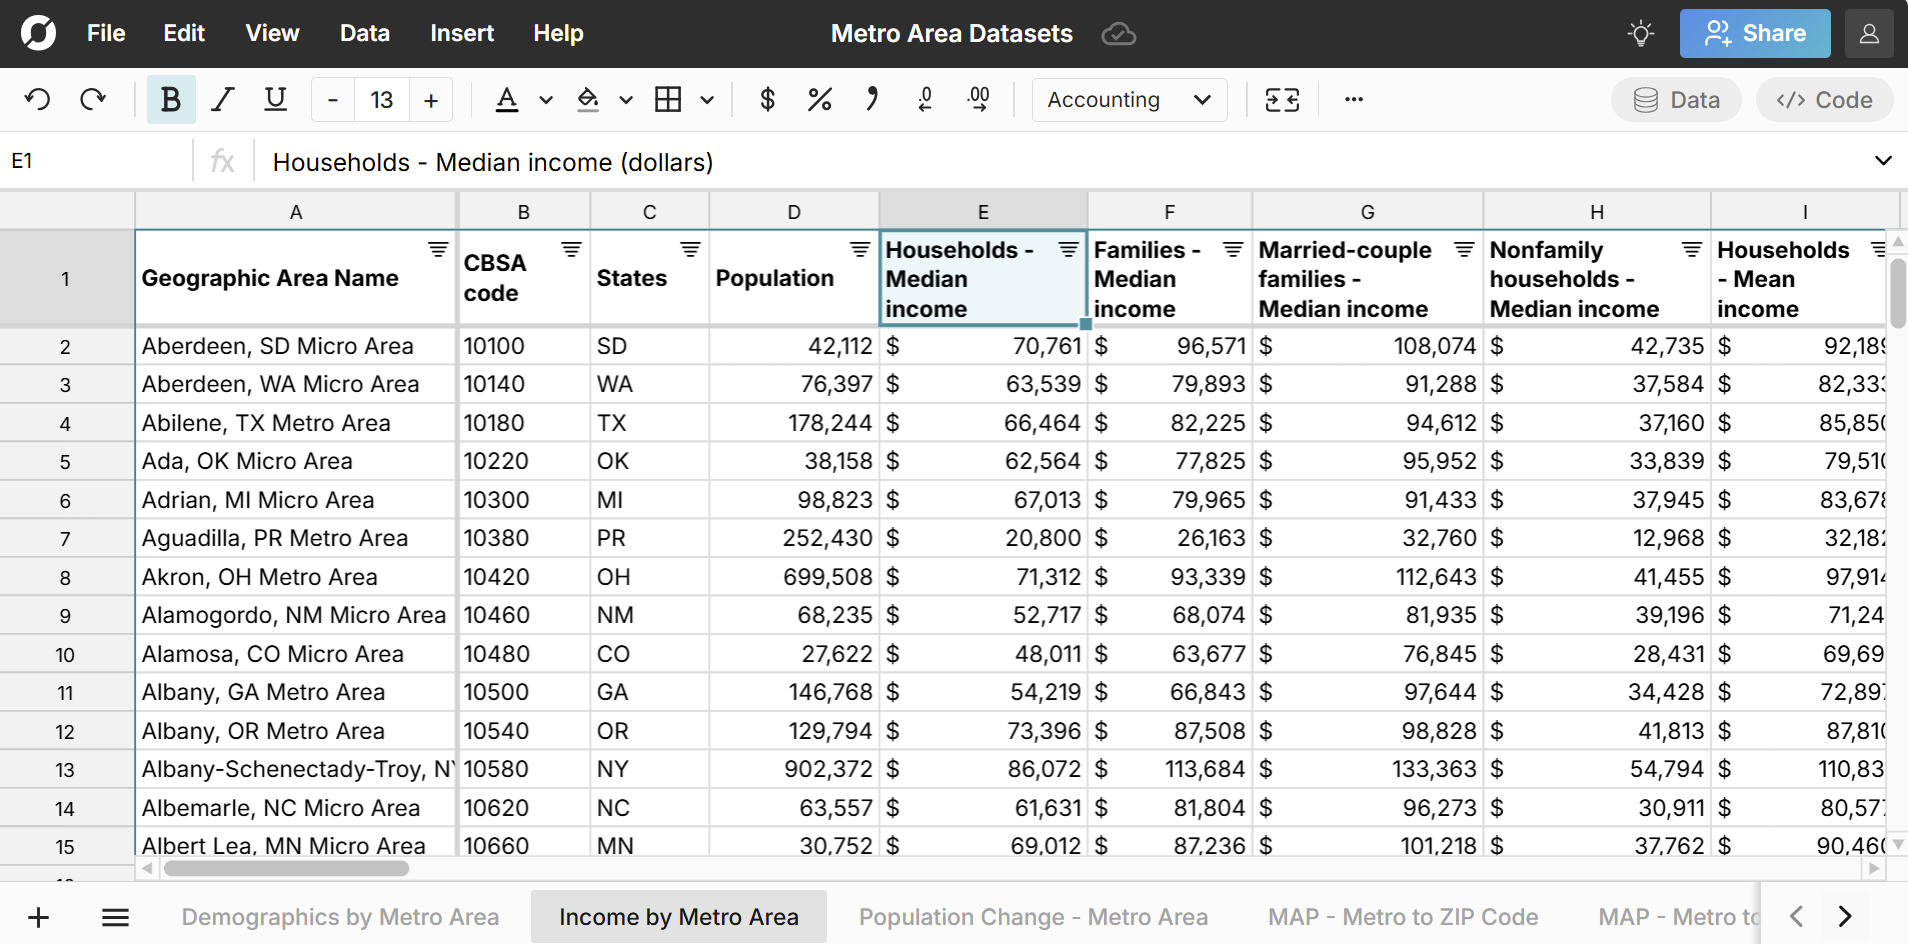 The income breakdown for each CBSA includes counts and percentage for the following income brackets:
- Less than $10,000
- $10,000 to $14,999
- $15,000 to $24,999
- $25,000 to $34,999
- $35,000 to $49,999
- $50,000 to $74,999
- $75,000 to $99,999
- $100,000 to $149,999
- $150,000 to $199,999
- $200,000 or more
Population Change by Metro Area
The Population Change by Metro Area sheet lets you explore metro area population change over time, including births, deaths, domestic migration, and international migration by metro area. See what metro areas attract the most new movers. 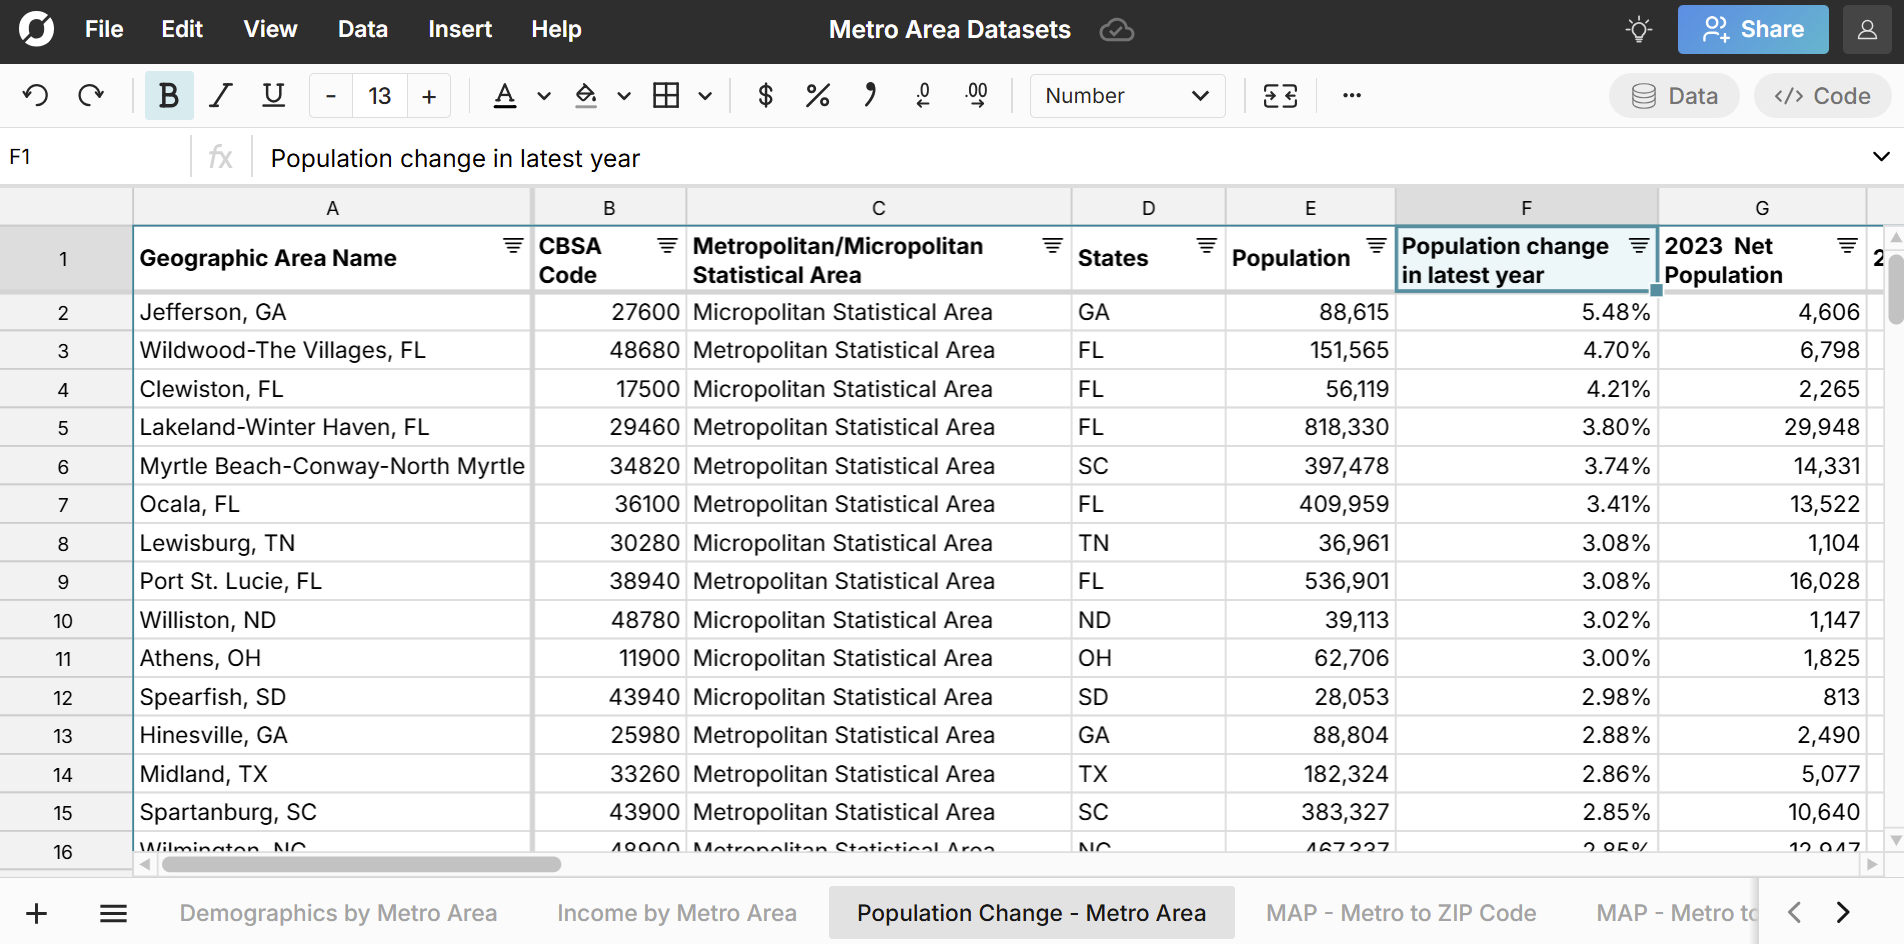
ZIP Code to Metropolitan Statistical Area Mapping
The MAP - ZIP to Town, Metro, State sheet maps the list of all U.S. ZIP codes to their metro area and state and includes the ZIP code population and ZIP to CBSA codes. 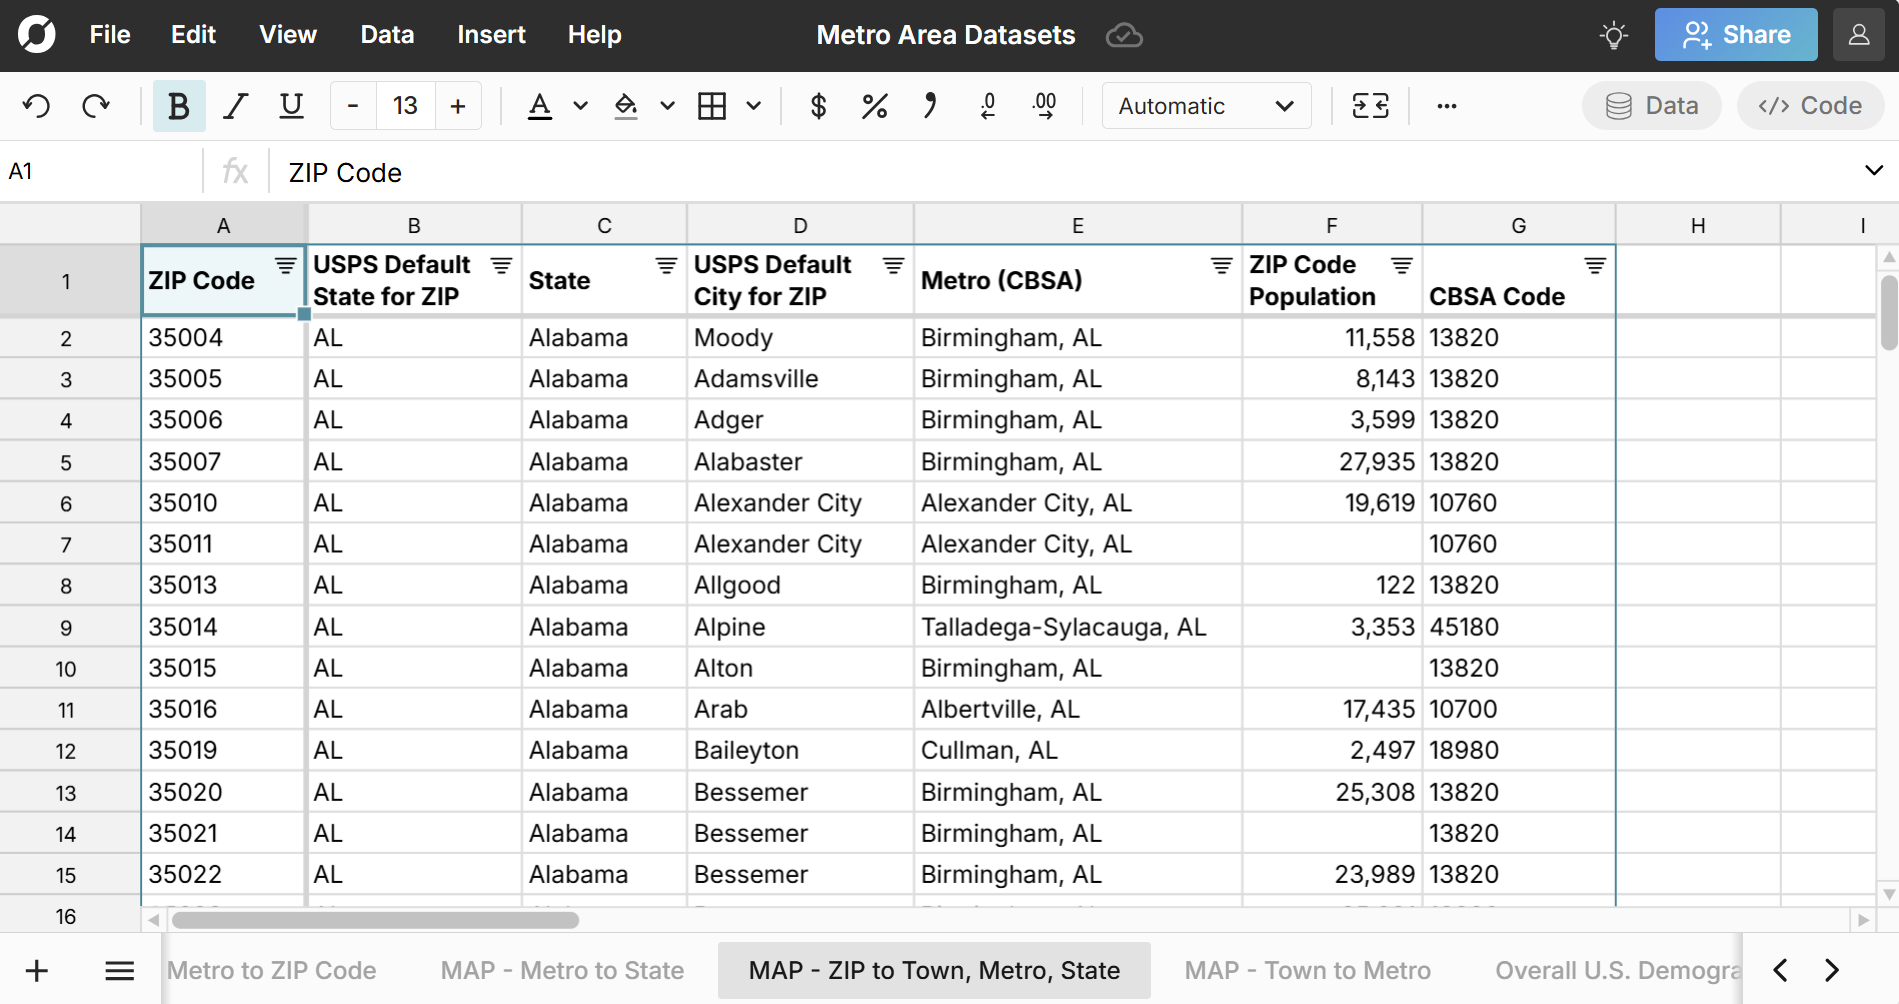
List of ZIP Codes by Metro Area
The MAP - Metro to ZIP sheet lists the ZIP codes in each metropolitan statistical area and includes the percent of the metro in each ZIP code so you can sort the largest ZIP codes in each metro area.  View ZIP code demographics data.
Map Town to Metro
The MAP - Town to Metro sheet maps each U.S. town and city to metropolitan statistical area and micro area. View demographics by city and town here.
Map Counties to Metros
The MAP - Metro to County sheet maps each micro and metro area to counties it overlaps with and includes the CBSA to County FIPS code crosswalk. Each county is designated as either Central or Outlying for each metro area. You can easily filter on Metro Area to see the list of counties in each metro area. 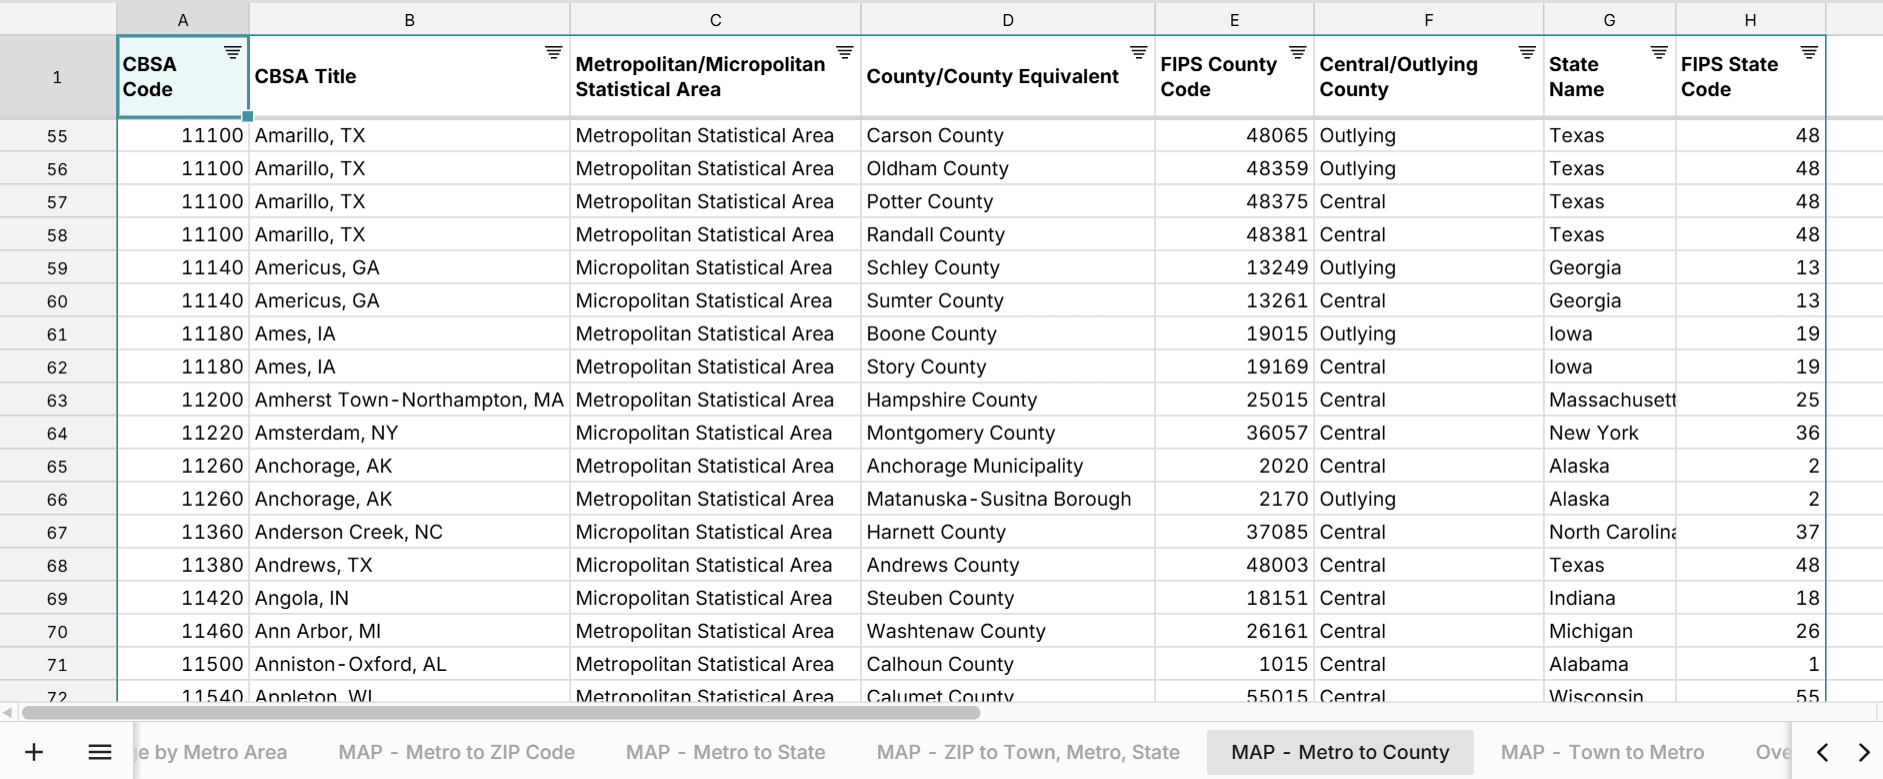 View demographics by county here.
Map Metros to States
The MAP - Metro to State sheet maps each metropolitan statistical area to states it overlaps with. View demographics by state here.
Overall U.S. Demographics and Income
The last two sheets include overall U.S. demographic data and income so you can compare each metropolitan statistical area and micropolitan statistical area to the U.S. overall.
Highlights from the Dataset
Largest Metro Areas in the U.S.
Top 10 most populated metro areas in America:
- New York City Metro Area - 19,756,722
- Los Angeles Metro Area - 13,012,469
- Chicago Metro Area - 9,359,555
- Dallas-Fort Worth Metro Area - 7,807,555
- Houston Metro Area - 7,274,714
- Washington, DC Metro Area - 6,263,796
- Philadelphia Metro Area - 6,241,882
- Atlanta Metro Area - 6,176,937
- Miami Metro Area - 6,138,876
- Phoenix Metro Area - 4,941,206
Compare this to the median metro population of 245,973 residents. You can also easily filter the spreadsheet to see the largest metros by race, age group, or gender breakdown.
Metros with the Most
The following are metro areas that rank highest or lowest on a demographic statistic in 2023, the most recent year of data available. Note that most of these statistics are rolling 5-year estimates. Includes metros with a minimum population of 100,000.
Metro Area Population growth
- Fastest growing metro by population: Dallas Fort Worth Area, TX +152,598
- Fastest growing metro area by percentage: Wildwood-The Villages, FL +4.7%
- Fastest shrinking metro area by population: Los Angeles Area, CA -71,037
- Fastest shrinking metro area by percentage: New Orleans Metro, LA -1.2%
Metro Area Migration Inflows and Outflows
- Most domestic migration gain: Dallas-Fort Worth Area, TX +60,457
- Most domestic migration gain (as %): Wildwood-The Villages, FL +5.7%
- Lost most domestic migration: New York City Metro Area -238,494
- Lost most domestic migration (as %): New Orleans Metro, LA -1.8%
- Most international migration: New York City Metro Area +104,923
- Most international migration (as %): Miami Area +1.5%
- Lost international migration: Medford, OR lost 9 residents
Metro Area Age and Gender
- Highest percent 65 and older: Wildwood-The Villages, FL 57.8% 65 and older
- Highest percent Under 18: Provo-Orem-Lehi, UT 32.2% under 18
- Highest percent Under 5: Provo-Orem-Lehi, UT 8.7% under 5
- Highest Male percentage - Jacksonville, NC - 55.8% are Male
- Highest Female percentage - Amherst, MA - 53.2% are Female
Metro Area Income
- Highest income metro area: San Jose-Sunnyvale-Santa Clara, CA - $157,444 median household income
- Lowest income metro area: Monroe, LA Metro Area - $49,203 median household income
- Most unequal income metro area: Bridgeport-Stamford-Danbury, CT - 1.65 mean to median income ratio (Mean of $184,106 and median of $111,656)
- Highest percent making $200K or more: San Jose-Sunnyvale-Santa Clara, CA at 39.4%
Data Sources
Data sources for this metropolitan statistical area dataset include the U.S. Census Bureau 5-year estimate tables from the American Community Survey, as well as the U.S. Office of Housing and Urban Development. Data has been updated as of October 2025 with the most recent data available.