Explore NYC taxi ride data in a spreadsheet. The dataset contains ~60 million rows of data from all New York City yellow taxi rides from 2024 - May 2025 from the NYC Taxi and Limosine Commission. Yellow or “medallion” taxis are New York City-licensed taxis that can pick up or drop-off passengers anywhere within the city limits of New York City. Columns include pick up and drop-off times and locations, trip distances, number of passengers, fare and tax amounts, as well as many others. Additional data going back to 2009 is available from the TLC site in monthly Parquet files that can be easily imported into a Row Zero workbook. Explore the 60 million row NYC taxi dataset in Row Zero, an enterprise-grade spreadsheet for big data.
Dataset Summary
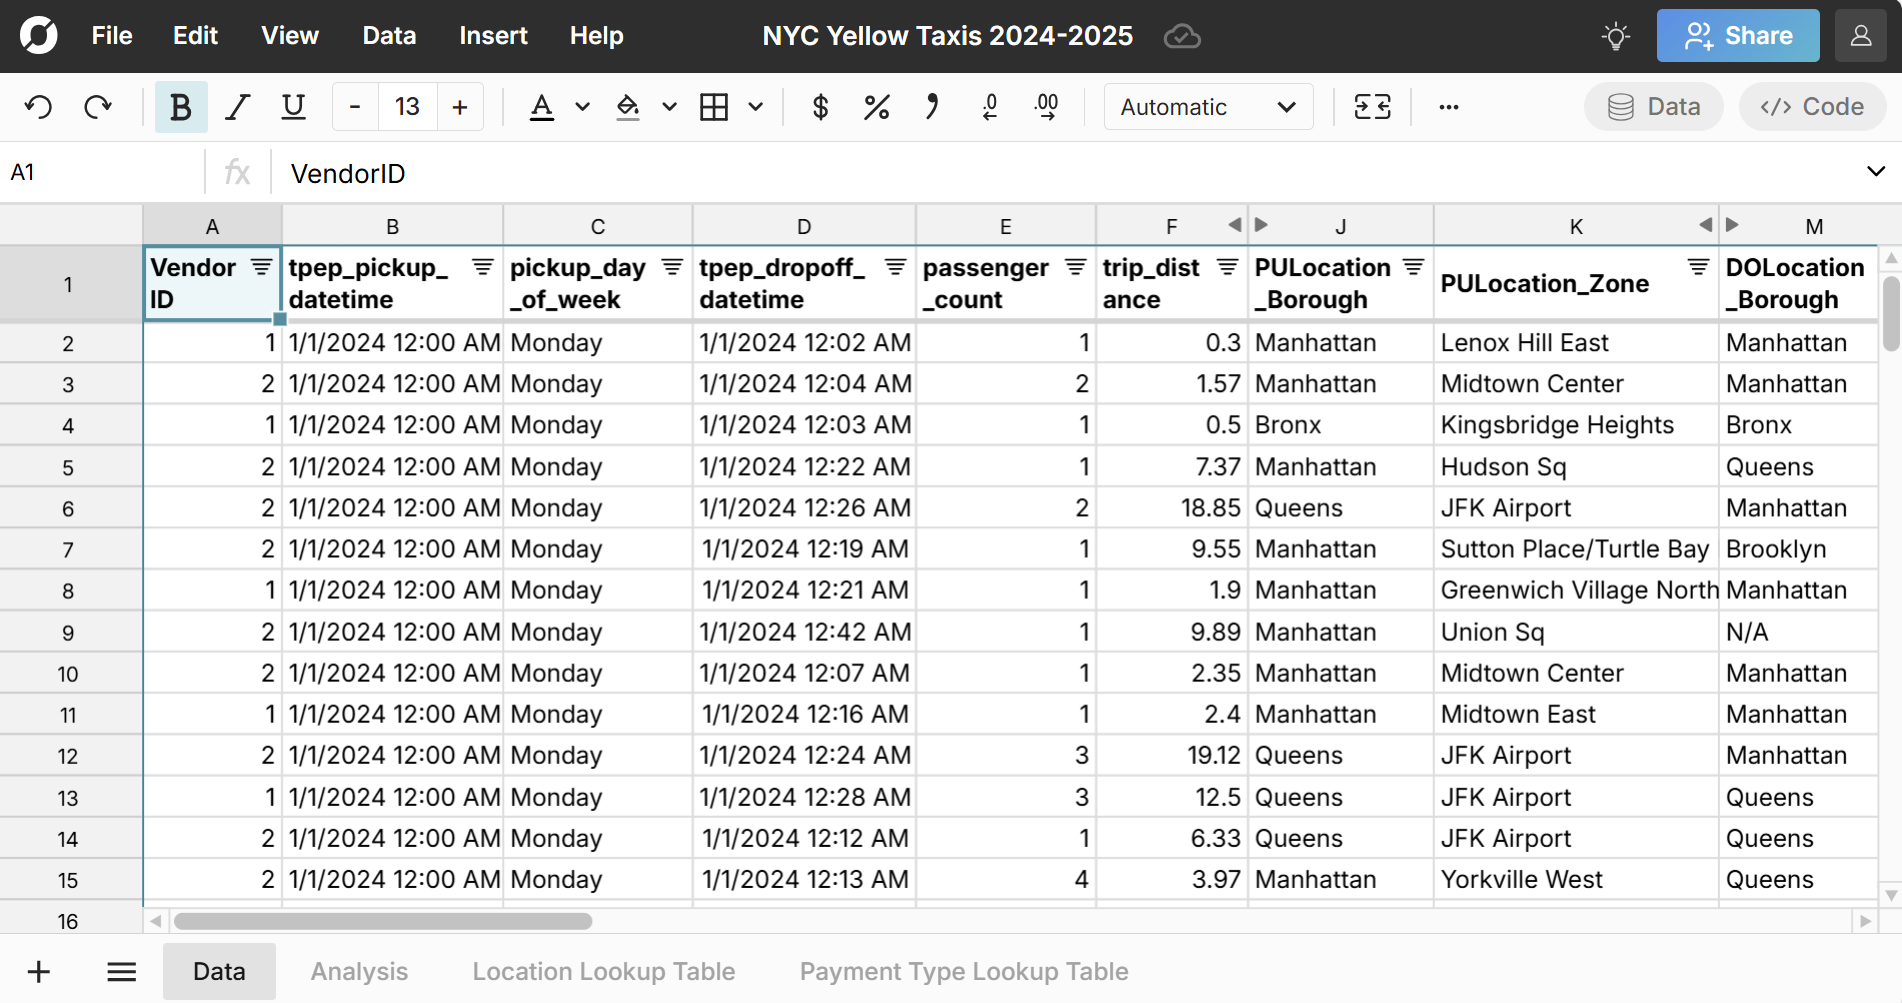
The dataset contains ~60 million rows of NYC taxi data. Each row corresponds to a New York City yellow taxi ride, with a passenger pick up and drop-off. In the Row Zero workbook, the core dataset is on the “Data” tab.
In addition to the fields listed in the NYC TLC data dictionary, we’ve added some additional columns to enrich the dataset:
- Day of Week (pickup_day_of_week) - gives the day of week of the pick up time
- Pickup Location Borough (PULocation_Borough) - pulls values from NYC TLC location lookup table, provided on the Location Lookup tab of the workbook
- Pickup Location Zone (PULocation_Zone) - pulls values from Location Lookup tab
- Dropoff Location Borough (DOLocation_Borough) - pulls values from Location Lookup tab
- Dropoff Location Zone (DOLocation_Zone) - pulls values from Location Lookup tab
We have also removed a handful of records with obviously incorrect dates and times (dates in the future, dates far outside of the dataset time range, etc.) from the dataset. As mentioned above, the source of the data is the NYC Taxi and Limousine Commission, which lists monthly parquet files that can be downloaded and opened in Row Zero.
Highlights from the Dataset:
Count of Rides By Borough
An overwhelming percentage of rides are in Manhattan. This makes sense given how much activity, commercial and otherwise, happens in Manhattan. However, it’s a bit surprising given that Brooklyn and Queens have much larger populations than Manhattan (see below). 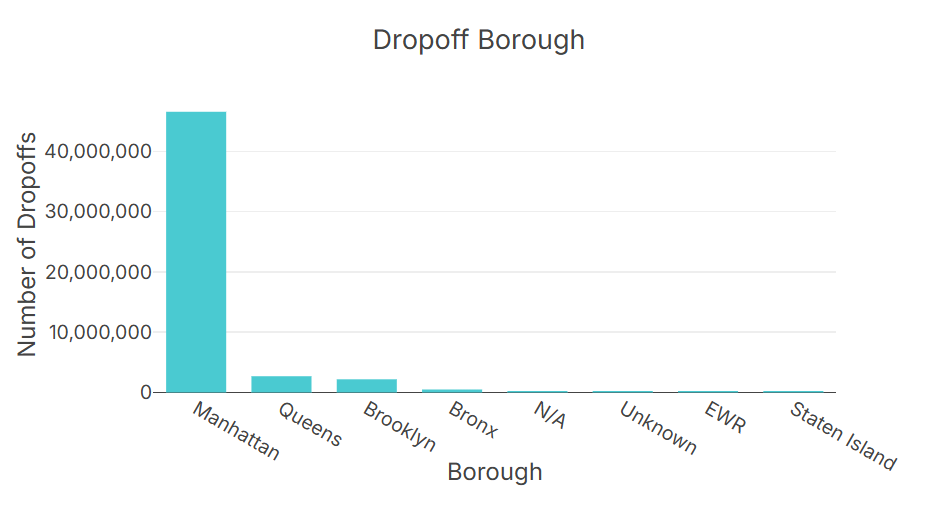
For reference: NYC population by borough according to the latest population data estimates from the American Community Survey (U.S. Census):
- Brooklyn: 2,646,306
- Queens: 2,330,124
- Manhattan: 1,627,788
- Bronx: 1,419,250
- Staten Island: 492,734
Percentage of Rides with an Airport Fee
A relatively large number of rides originate from airports. Roughly 8% of all rides are charged an airport fee, which is assessed when the passenger pickup is at LaGuardia or John F. Kennedy airport. You can view rides with an airport fee via the Airport_fee column.
Example Analyses
We can do some interesting analyses with just some basic spreadsheet formulas, pivot tables, and data visualizations. The pivot tables and data visualizations are available in the workbook on the Analysis tab.
Trips by day of week
Days get progressively busier for taxis as the week goes on. Sunday, Monday, and Tuesday have the least number of rides and Thursday, Friday, and Saturday have the highest number of rides. This may suggest that taxis are used more heavily for non-work commutes. 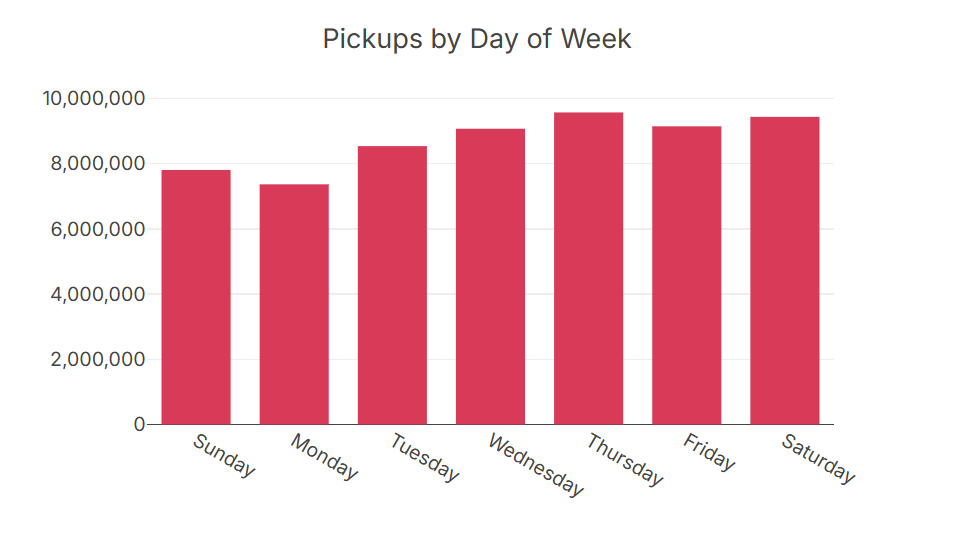
Payment Types and Impact of Flex Fare Trips
The main payment types for NYC yellow taxis are cash, credit card, and Flex Fare, which is an app-based e-hail system with upfront pricing, similar to Uber and Lyft. Flex Fare began in a pilot phase in 2018 and fully went into effect in January 2025. It’s clear from the 2025 months that Flex Fare is catching on as a way to pay for rides, while credit cards are also steadily increasing and amounts collected in cash are staying relatively flat. 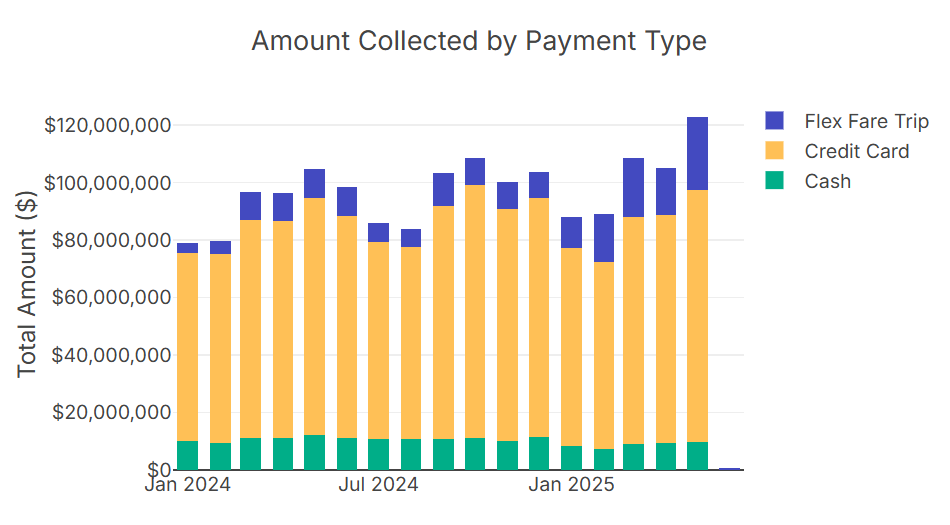
Passenger Count
An overwhelming majority of NYC yellow taxi rides are taken by single passengers. 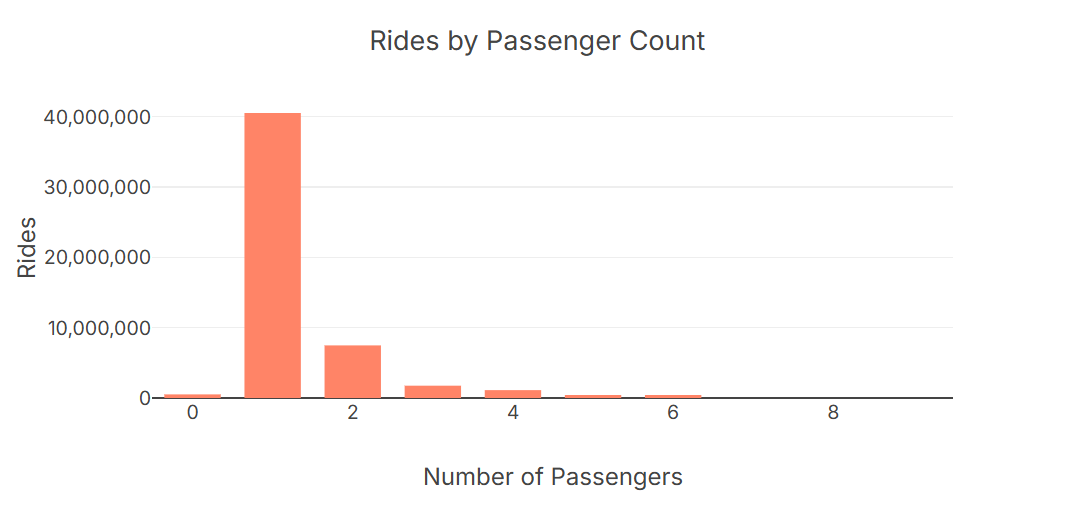
Impact of the Congestion Fee
The New York City congestion pricing plan, officially called the Congestion Relief Zone Toll, went into effect on January 5, 2025. The congestion pricing plan includes a surcharge for NYC yellow taxis. You can view rides that were assessed the surcharged in the cbd_congestion_fee column. Looking at total rides by month, it doesn’t appear that the congestion tax negatively impacted ridership, although it’s difficult to know if the uptick in rides in 2025 is caused by passengers who previously drove cars taking more taxi rides or some other factor. 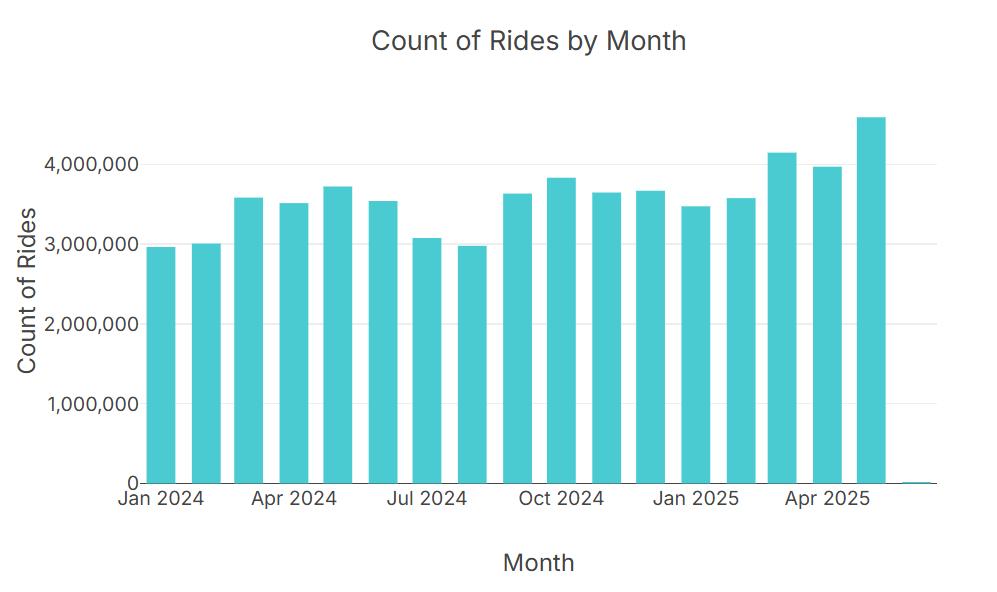
Expanding the Dataset
The NYC TLC data site has additional data going back to 2009, as well as data for other types of cabs, including green taxis, for-hire vehicles, and high volume for-hire vehicles. All data is available from the site in monthly Parquet files that can be easily imported into a Row Zero workbook.
Data Source
The source for this dataset is the NYC Taxi and Limousine Commission. You can download monthly parquet files of NYC taxi data from the site going back to 2009. Data in the spreadsheet is from January 2024 to May 2025.