Explore a large sample dataset of 31 million rows of NY state hospital admissions from 2009 to 2021. Explore for free in Row Zero, the world's most powerful spreadsheet.
Dataset Summary
This spreadsheet includes 31 million rows of NY hosptial admissions data from 2009 to 2021 and is 2.5GB of data. There is one row for each patient. 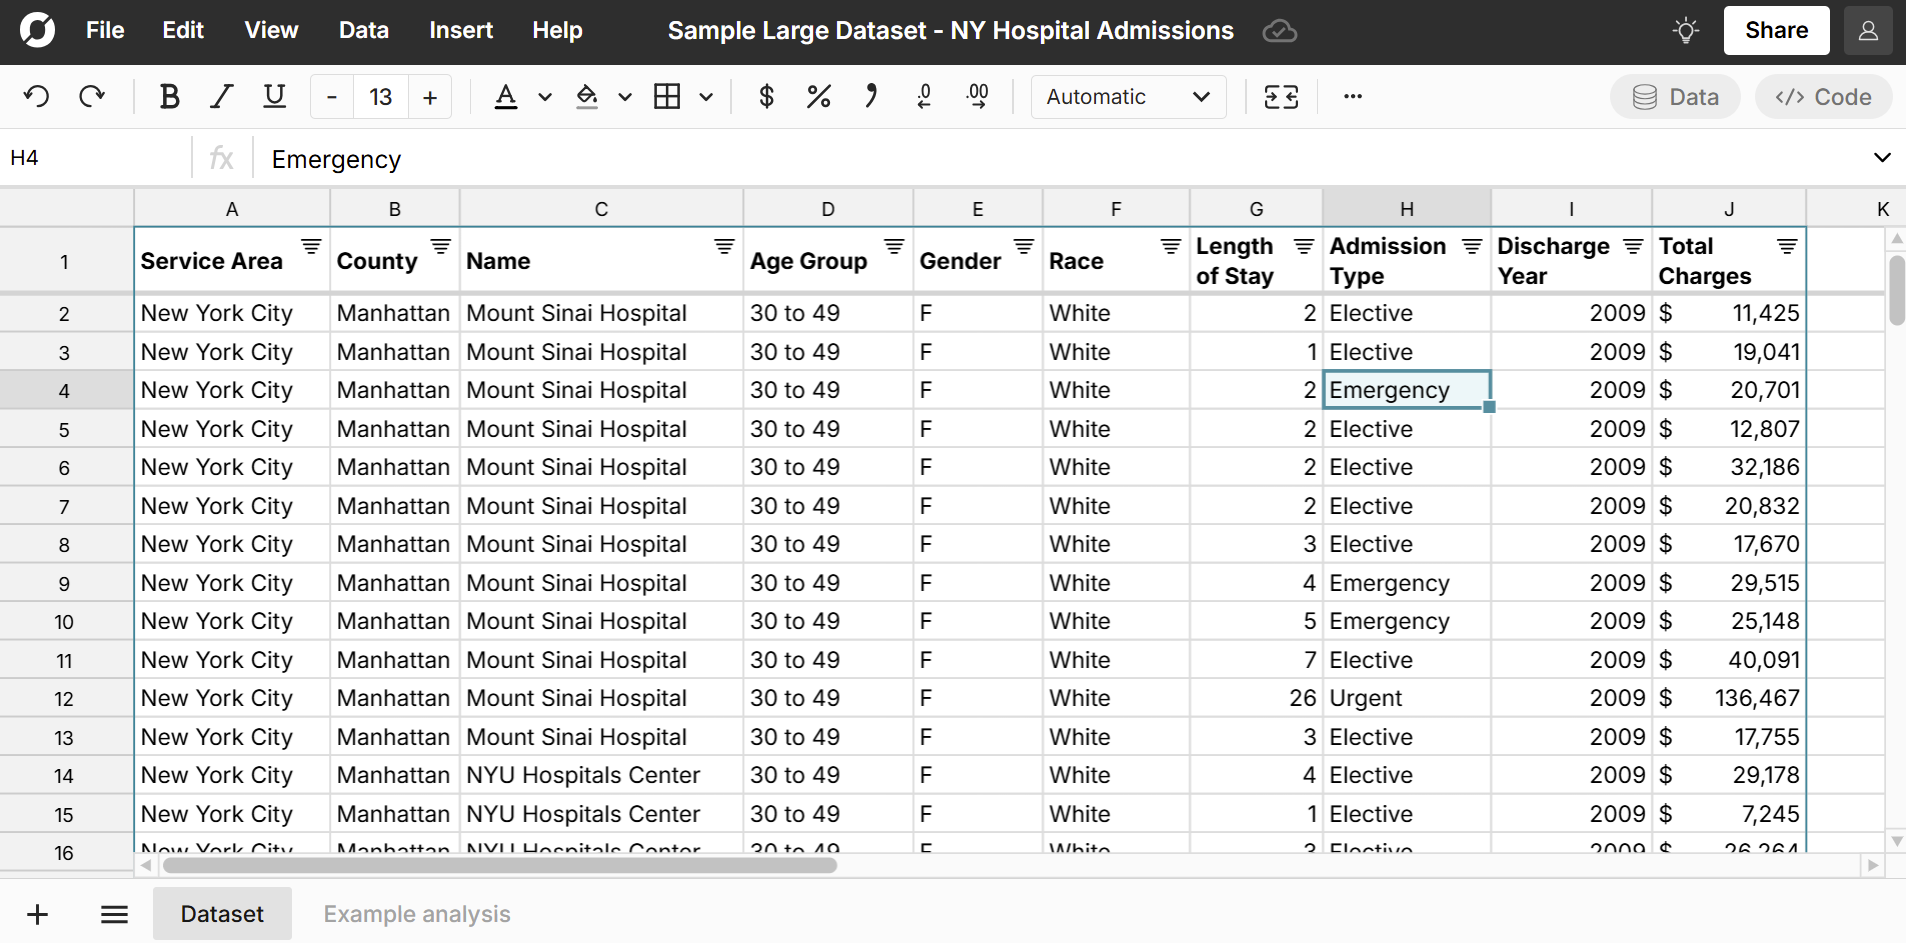 Columns include Service Area, County Name, Age Group, Gender, Race, Ethnicity, Length of Stay, Admission Type, Discharge Year, Total Charges
Example Analysis
In the Example Analysis sheet, we created a pivot table to look at hospital admissions by type by year. 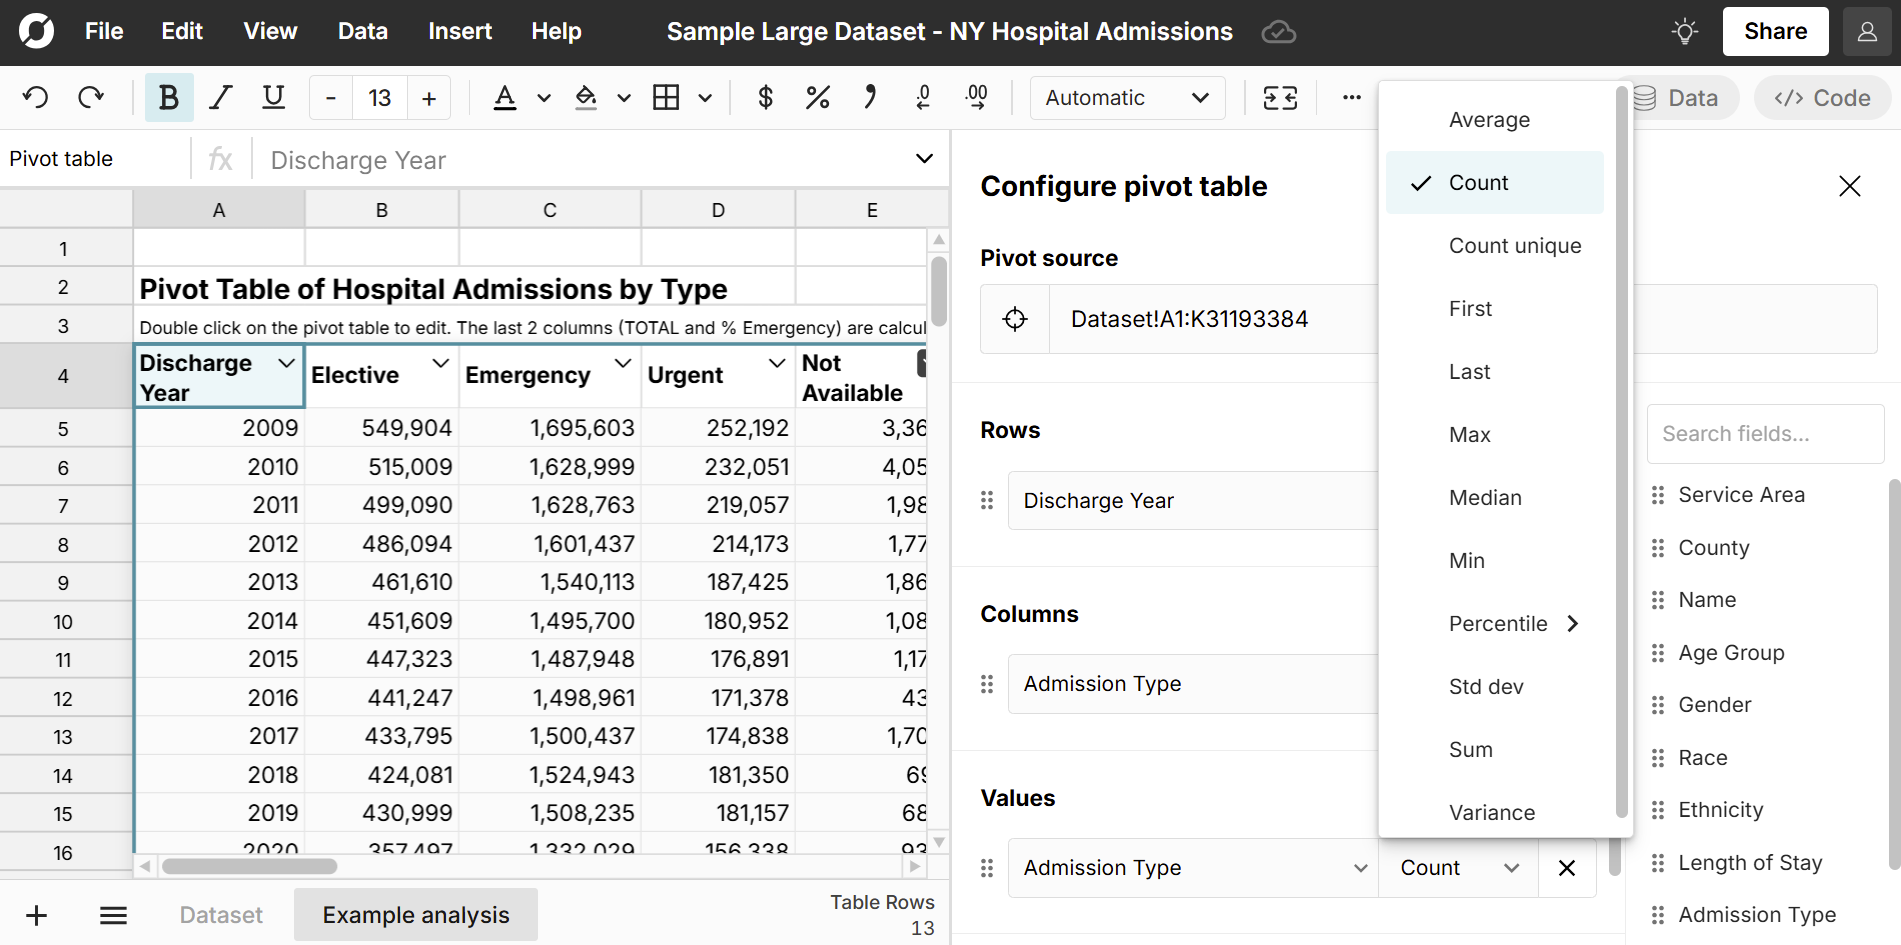
We next added calculated columns to the pivot table. Row Zero formulas are Excel-compatible. You can view the full list of spreadsheet functions here. 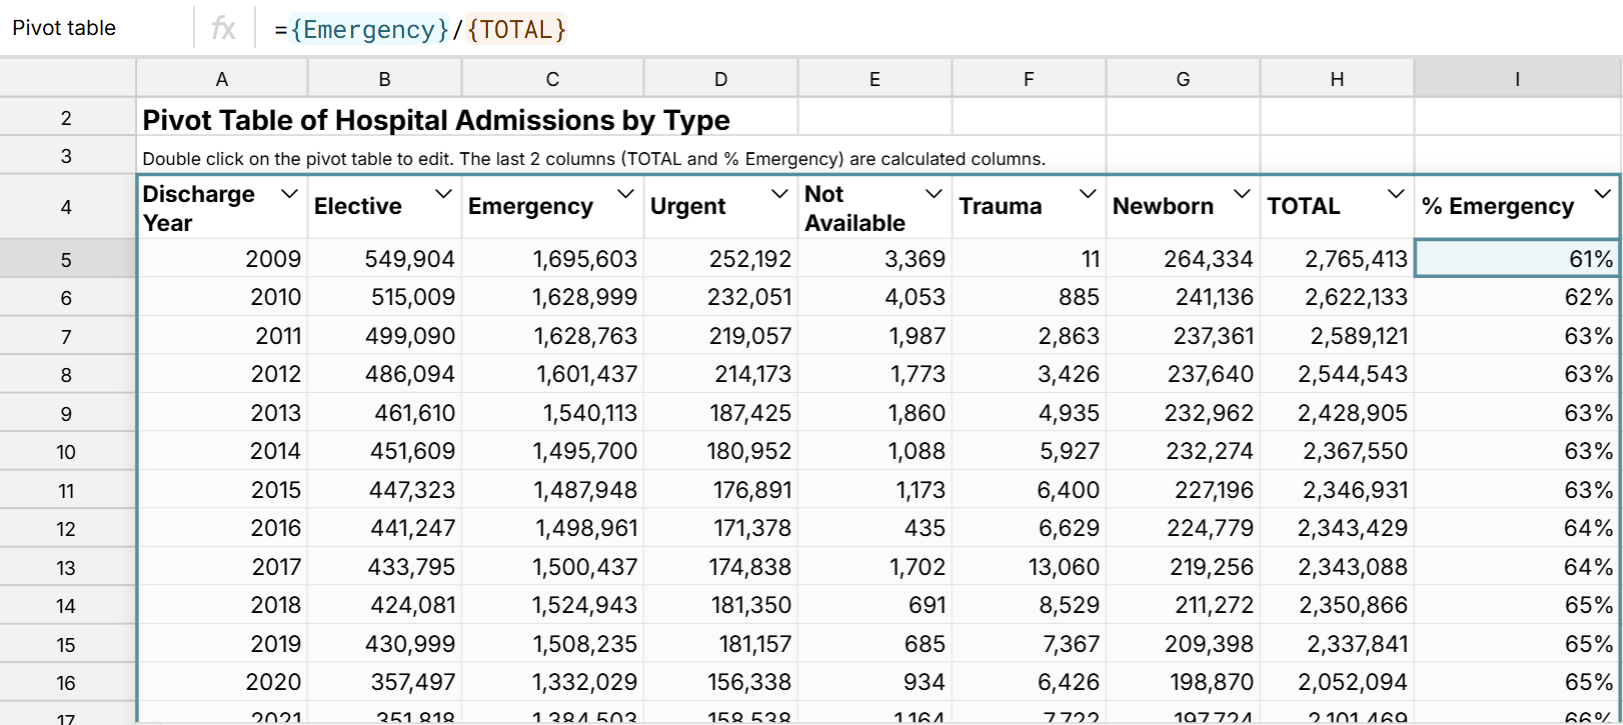
Next we can chart the pivot table data to explore trends in hospital admissions over time: 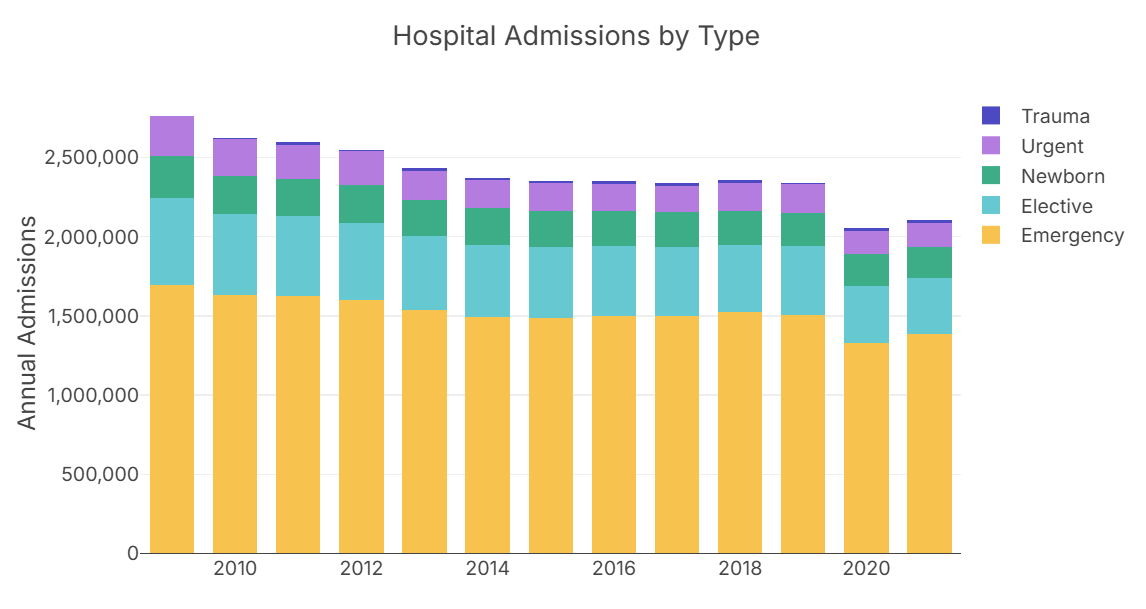
We used a stack bar chart, but you can double click on the chart to make changes. The chart shows that emergency visits dominate hospital admissions. We can also see a dip in hospital admissions in 2020 during the COVID pandemic.
Note that Row Zero charts and pivot tables are dynamic. So if you filter, sort, or edit the source data, the pivot table updates automatically. The pivot chart is also dynamic. If you filter the pivot table or adjust the source data, the chart updates dynamically.