Open Free Fantasy Football Stats Template
Pull NFL fantasy football statistics into a Row Zero spreadsheet using the nfl_data_py Python package and give yourself a better chance at winning your fantasy football league. Using a few pre-written python functions, this post will show you how to use Python to pull fantasy football stats into a spreadsheet where normal spreadsheet functions can be used to analyze the data and pick your team. This analysis is based in Row Zero, a blazingly fast spreadsheet that supports python functions and data import from the web.
This post contains the following sections:
- nfl-data-py Python package overview
- Getting started with Row Zero and nfl-data-py
- Import Python packages
- NFL player seasonal data
- Play-by-play data for any NFL season
- Weekly stats for NFL players by season
- Next generation NFL stats
- Weekly NFL roster data
- FTN stats
- Conclusion
nfl_data_py Overview
nfl_data_py is an open source Python package with many different contributors. You can learn more about the contributors or even contact them on the nfl_data_py Github page. The Python package pulls data from nflfastR, nfldata, and Draft Scout. Using these sites, the nfl_data_py can pull together a bunch of different statistics that make it easy to decide which players to draft, which players to play, and which players to drop during the season.
Getting started with nfl-data-py and Row Zero
Getting started is easy. Click on the link below to open the free template workbook. You will need to create a free Row Zero account to save the workbook. Once the workbook is open,
First, go to Row Zero Sign up to create your free Row Zero account. Once logged in, you will see the Row Zero spreadsheet. To get acquainted, there are two features of Row Zero most pertinent to this analysis, the spreadsheet and the code window. 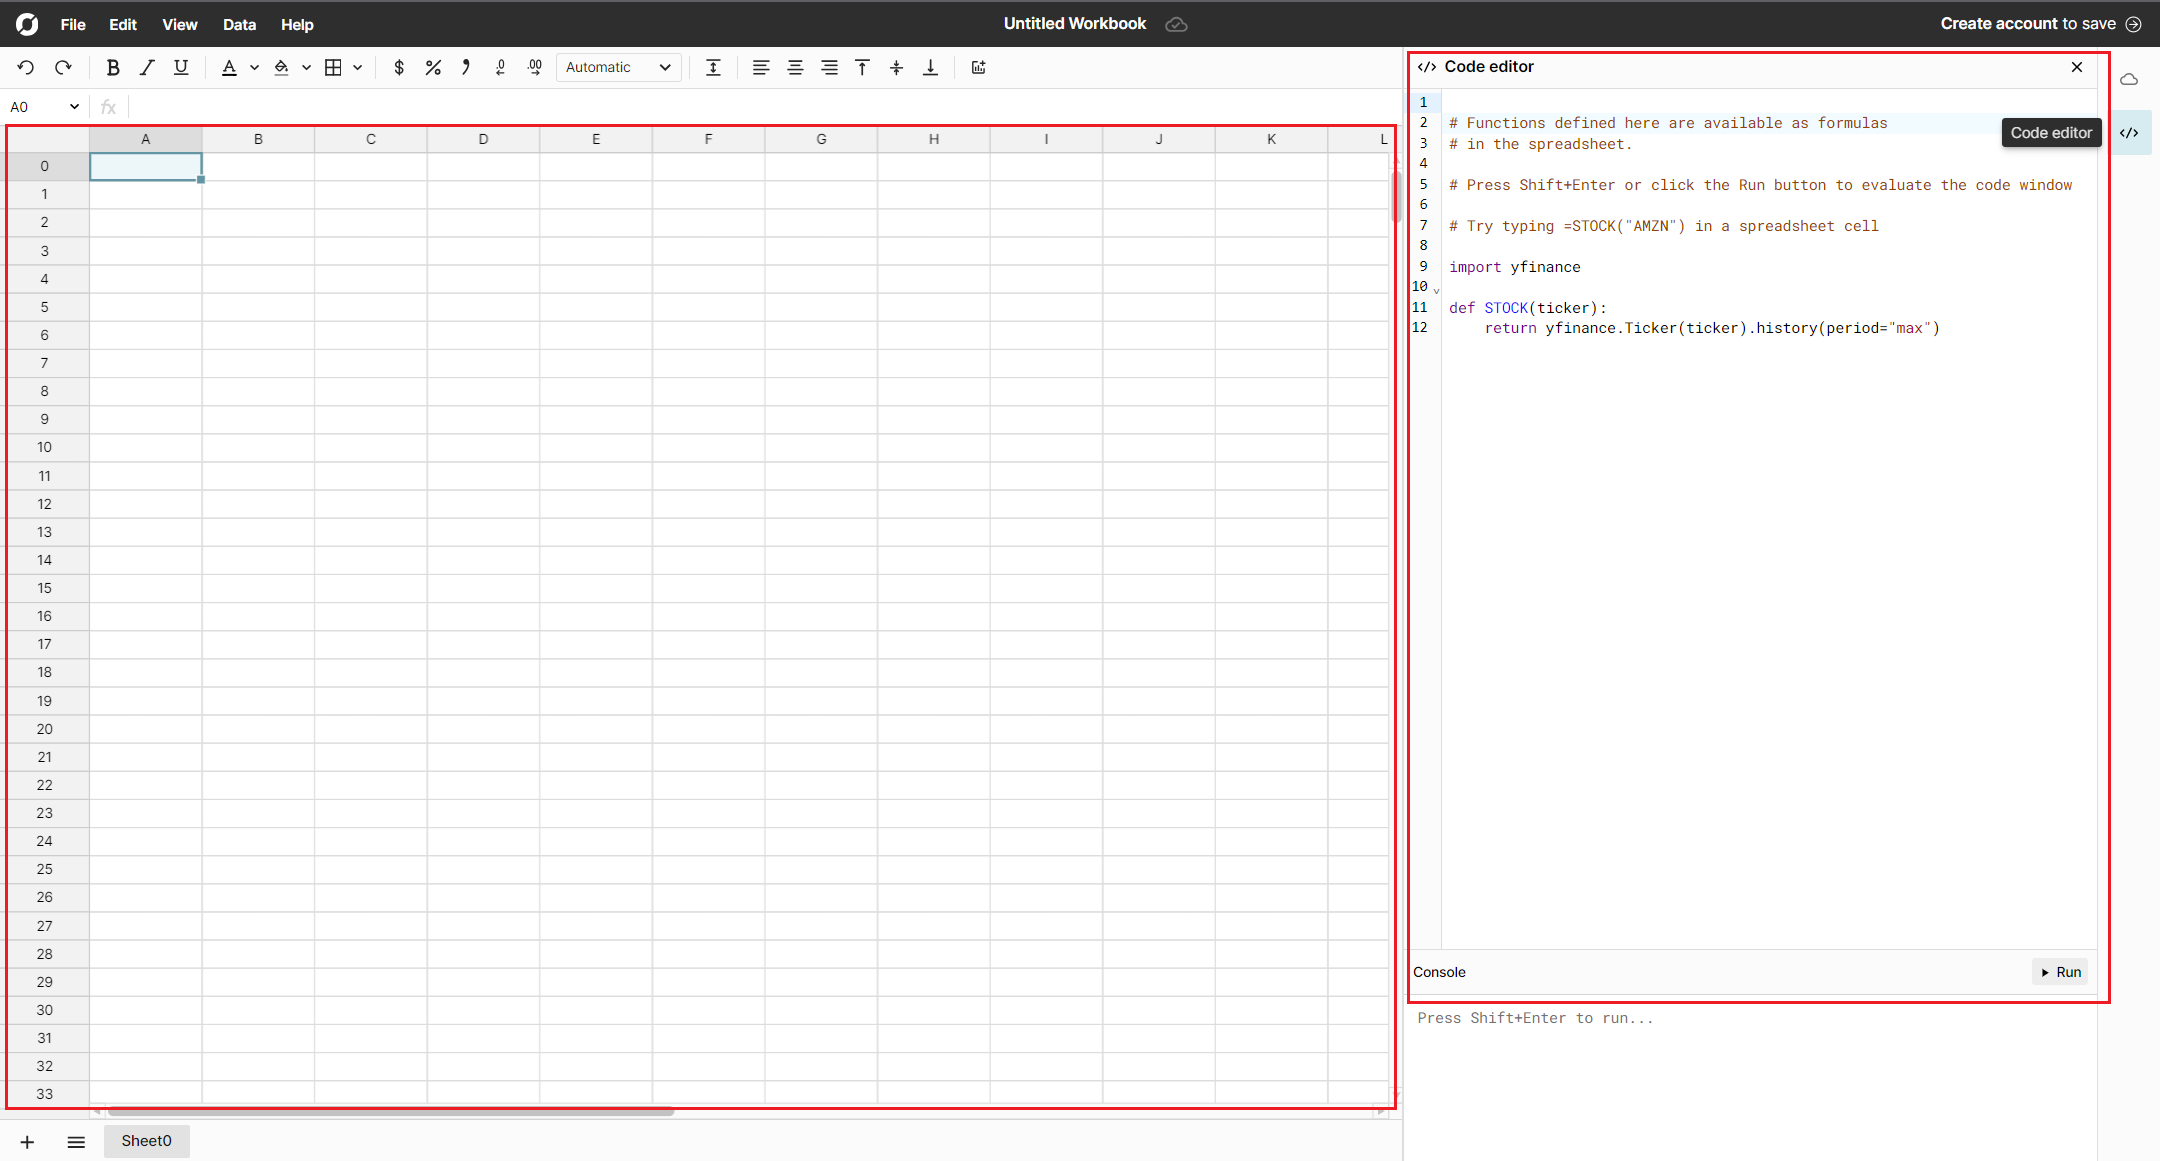
Import Python packages
The first step is to import the Python packages needed for this analysis, which are the nfl_data_py package, pandas (data table functionality), and plotly.graph_objects. Those packages can all be imported by typing the following commands into the code window and hitting the 'run' button. Follow this link for detailed instructions on the Row Zero code window.
import pandas as pd
import plotly.graph_objects as go
import nfl_data_py as nfl
NFL player seasonal data
To get player level data from each NFL player in a particular season, we use the function below. Player level data can be used to easily answer questions like who had more TDs Aaron Jones or AJ Dillon? The seaonsal data will return a data table in which there is a row for each player, listed alphabetically and every column is a common NFL stat you can use in your analysis. For more details on data tables, see our documentation here. If it's easier to work in normal spreadsheet mode, use the Explode feature by right clicking on the data table and then clicking 'explode' to paste values from the data table into the underlying cells. Then build your analysis, write vlookups, and create projections on what players will do this season. Work in Row Zero the same way you would in other spreadsheets, like Excel or Google Sheets.
def get_seasonal_data(year):
    year_list = []
    year_list.append(int(year))
    df = nfl.import_seasonal_data(year_list)
    id_df = nfl.import_ids()
    id_df = id_df[['gsis_id','name']]
    df = pd.merge(df,
                     id_df,
                     left_on = 'player_id',
                     right_on = 'gsis_id',
                     how ='left')
    cols = df.columns.tolist()
    cols = cols[-1:] + cols[:-2]
    df = df[cols]
    df = df.sort_values('name')

    return df
Once the function is created, type the function into a cell in the spreadsheet and either reference a cell with the year or include the year in the function. For example =get_seasonal_data(B0) where B0 contains the year 2023 or type =get_seasonal_data("2023") into a cell and all data will spill into the cells below. Once the data populates, use the column headers to filter and sort to the data you need or start building your model in the spreadsheet cells around the data table. 
Play-by-play data for any NFL season
Using play-by-play NFL data to select your fantasy football team can be a strategic advantage. By analyzing statistics like touchdowns, receptions, yards gained, and more on a play-by-play basis, you can make informed decisions on your roster. Additionally, tracking player consistency and performance trends throughout the season allows you to adapt your team and make well-informed choices during draft day and weekly lineup changes.
If you want to get play-by-play data for a specific season to assess stats like the average number of yards a team or player gets on 3rd downs, the following code is for you. The function below will run the Python script to pull statistics for every play in a particular nfl season. For example, the data for the 2022 seasons has more than 50,000 rows with details like a play between Washington and Arizona on Sept 10, 2023, starting in the 1st quarter on the WAS 48 yeard line "(13:16) (Shotgun) 14-S.Howell pass incomplete short middle to 82-L.Thomas." To pull this data, create the play-by-play season data function:
def get_play_by_play_data(year):
    year_list = []
    year_list.append(int(year))
    df = nfl.import_pbp_data(year_list)
Like we referenced above, type the function into a cell in the spreadsheet and either reference a cell with the year or include the year in the function. For example =get_play_by_play_data(B0) where B0 contains the year 2023 or type =get_seasonal_data("2023") into a cell and all data will spill into the cells below. Once the data populates, use the column headers to filter and sort to the data you need or start building your model in the spreadsheet cells around the data table. 
Weekly stats for NFL players by season
To look at aggregated stats for your fantasy football team line-up and assess how many interceptions Matt Ryan threw in week 12 of the 2022 NFL season, use the function below. This function is executed just like the previous. Drop the function =get_weekly_data_(B0) into a cell and list the year in cell B0.
def get_weekly_data(year):
    year_list = []
    year_list.append(int(year))
    df = nfl.import_weekly_data(year_list)

    return df
Once the function is executed it will look like the output below which we ran for the 2022 NFL season. You will be able to review how particular players performed in each week of the season. 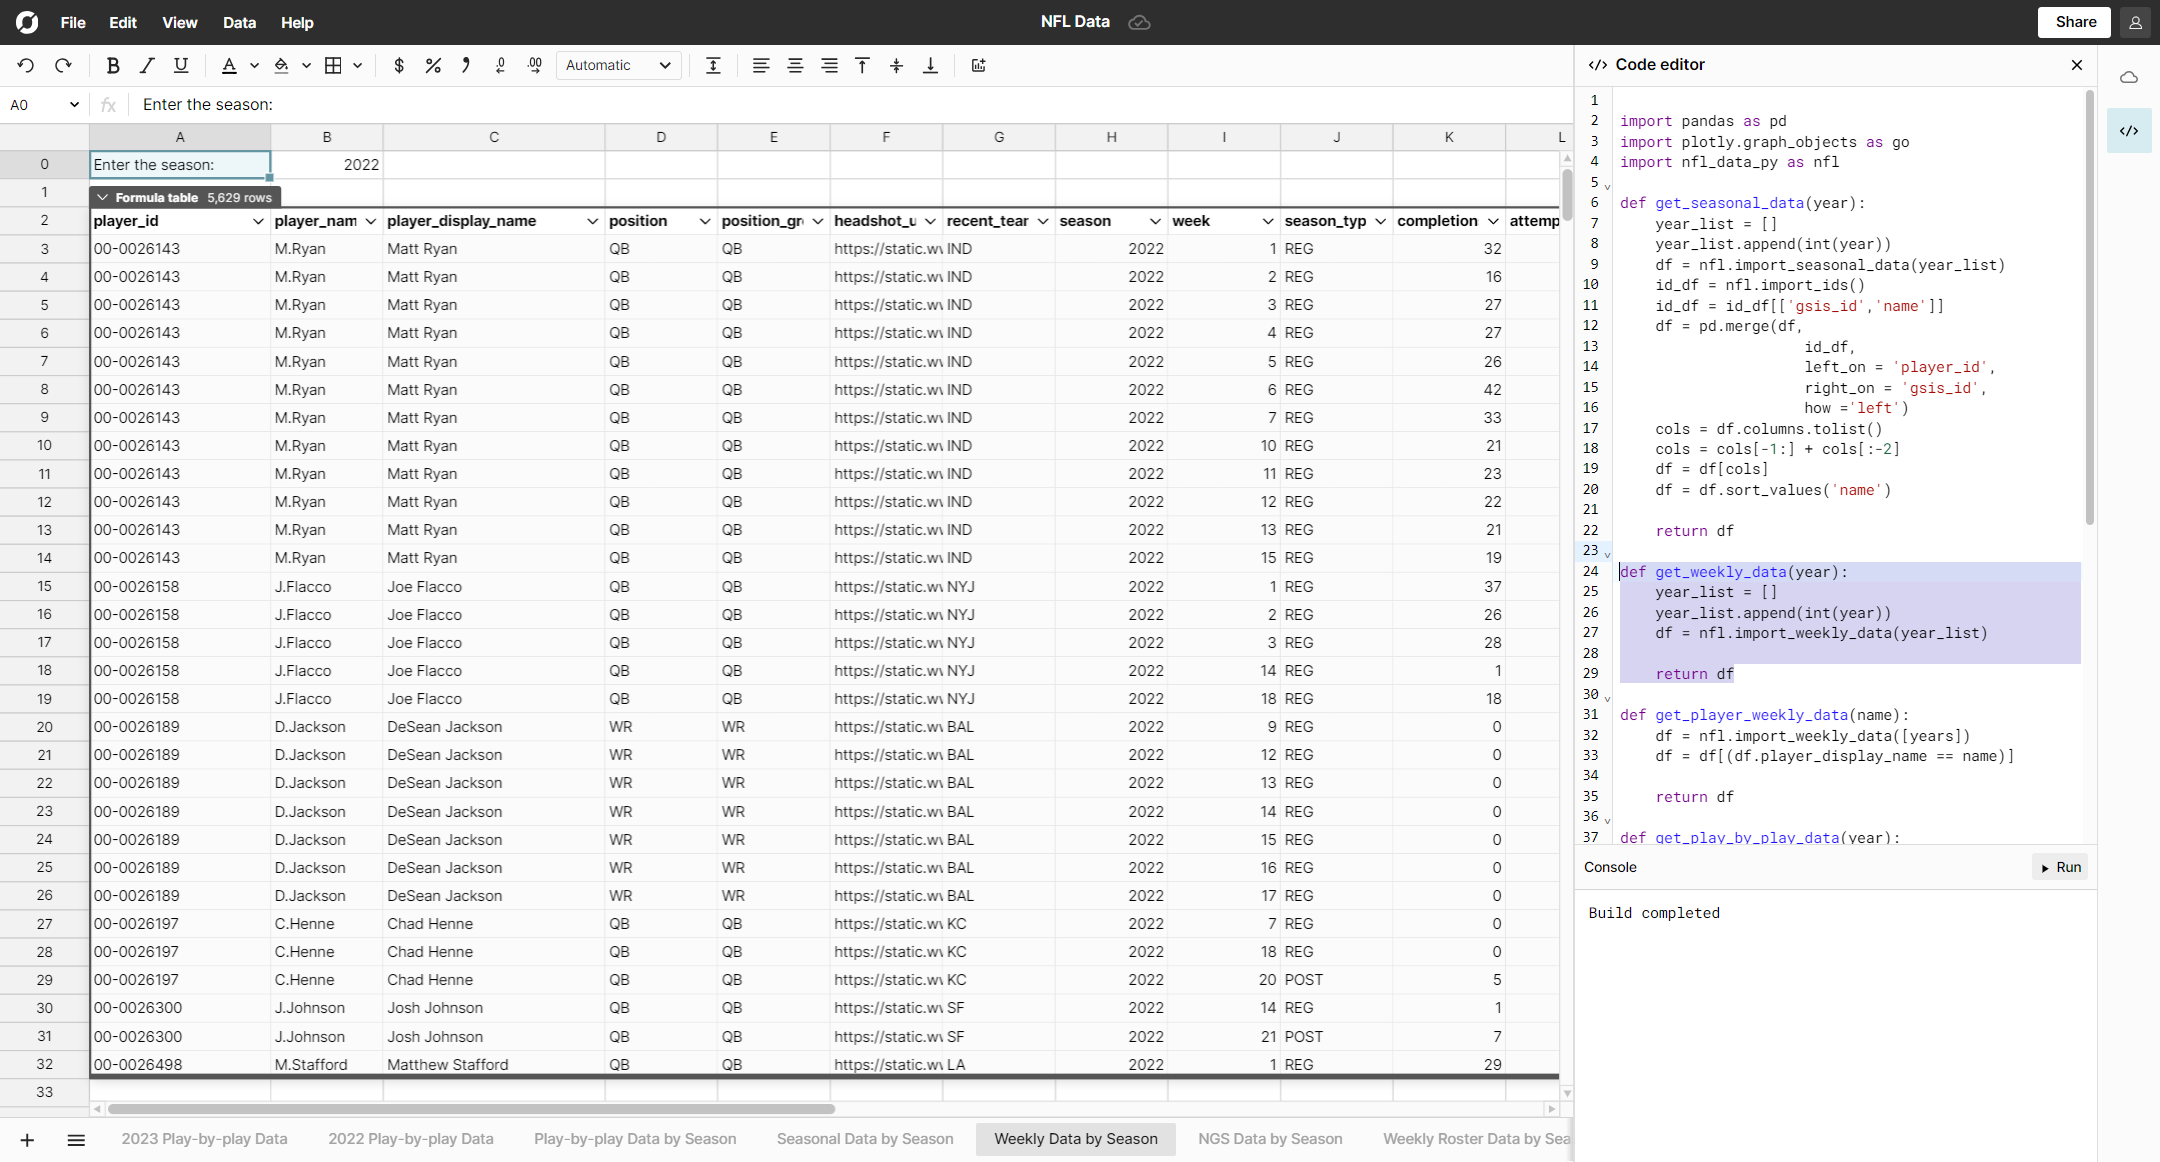
Next generation NFL stats by player
Leveraging next-generation (NGS) NFL statistics is a cutting-edge strategy to enhance your fantasy football team. These advanced metrics, such as player route maps, air yards, target separation, and more, offer a deeper understanding of player performance beyond traditional stats. Analyzing these statistics empowers fantasy managers to make informed decisions, identify breakout candidates, and recognize players with consistent production. Integrate these insights into your player research and draft strategy and gain a competitive edge.
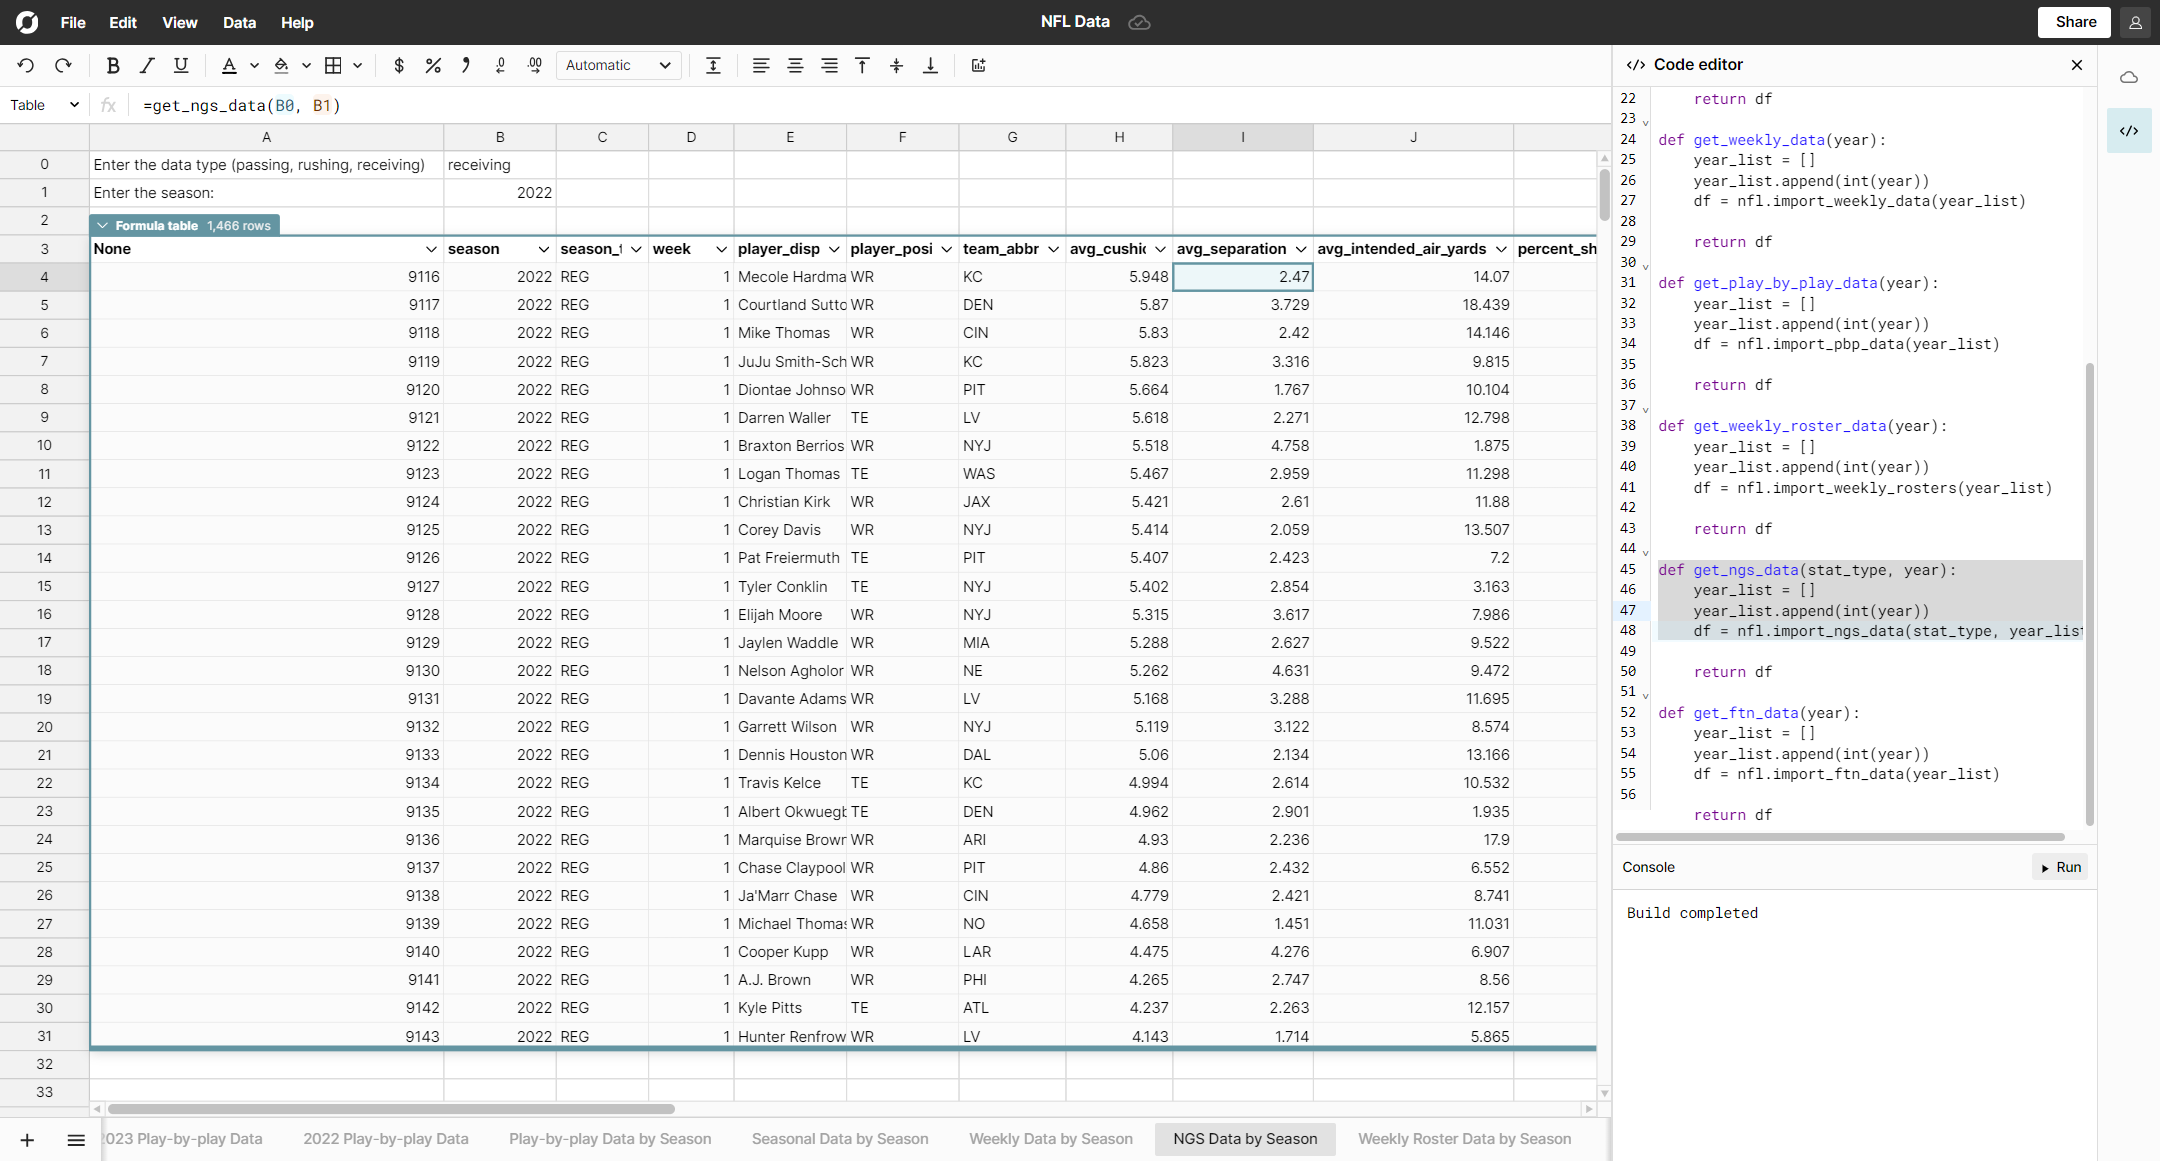
The next generation stats function requires two inputs, the stat_type (e.g. passing, rushing, or receiving), and the year. Next generation stats offer a look into things like average time to throw, completed air yards, average intended air yards, aggresiveness, max completed air distance, expected rushing yards, rush percent over expected, rush yards over expected, average separation, average yards after catch, average cushion, and percent share of intended air yards. Use the function below with the necessary inputs to pull data into the spreadsheet.
def get_ngs_data(stat_type, year):
    year_list = []
    year_list.append(int(year))
    df = nfl.import_ngs_data(stat_type, year_list)

    return df
Weekly NFL team roster data
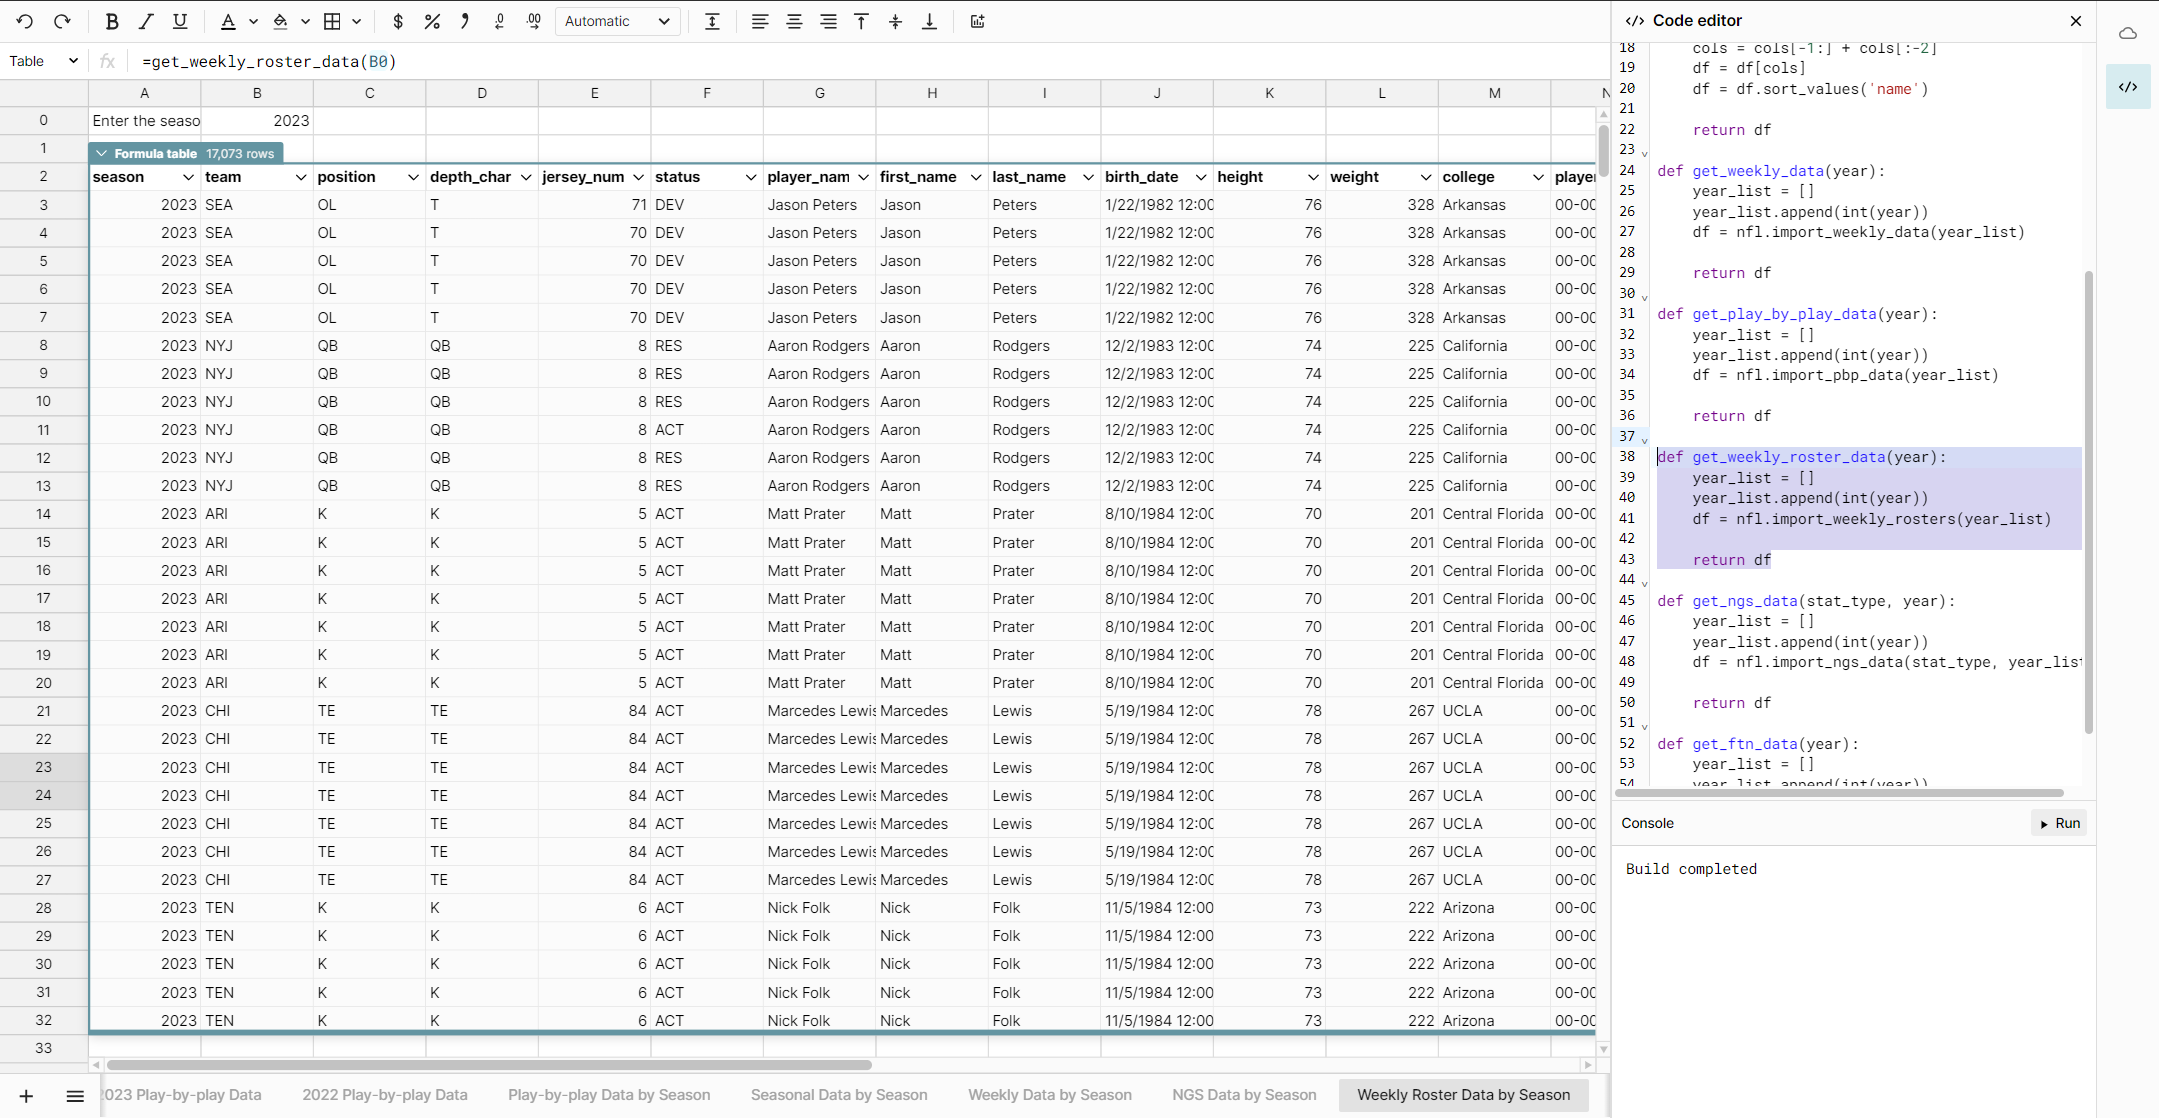
Utilizing weekly roster data is crucial for maintaining a competitive fantasy football team. By closely monitoring player injuries, matchups, and trends, you can make informed lineup decisions, optimizing your roster each week. Additionally, staying up-to-date with weekly roster changes allows you to capitalize on waiver wire opportunities and fine-tune your team for improved performance throughout the season. Roster data for each season provides data for fields like player status (active, injured reservet, etc...) height, weight, age, college, player ID, fantasy ID across all different fantasy league providers, draft team, draft year, draft place, and other metadata about each player. Use the function below and reference a cell containing the year pull in data, like the image below.
def get_weekly_roster_data(year):
    year_list = []
    year_list.append(int(year))
    df = nfl.import_weekly_rosters(year_list)

    return df
FTN Stats
Leveraging FTN football stats is a valuable strategy for enhancing your fantasy football team. FTN provides in-depth analytics, player projections, and expert insights to help you make data-driven decisions, optimizing your roster and improving your team's performance. You can access some of the FTN data using the function below. The FTN data includes individual play data, like QB location, no huddle, is play action, is trick play, is qb out of pocket, is throw away, is catchable, is contested, is QB sneak, is blitz, is pass rush, and a number of others.
def get_ftn_data(year):
    year_list = []
    year_list.append(int(year))
    df = nfl.import_ftn_data(year_list)

    return df

Conclusion
This post was an overview of a number of different ways you can use the nfl-data-py python package to easily pull NFL fantasy football stats into a Row Zero spreadsheet. We covered the basics to get anyone started with more advanced fantasy football analysis and to copy all the python functions at once, we've included them all below. Go even deeper and spend some time looking at the nfl-data-py page to see if there are other fields that would be helpful in picking a fantasy team. To get started, open a free Row Zero workbook, copy the functions from this blog, and give yourself a competitive advantage over the other fantasy mangers in your league. Lastly, if fantasy baseball is your thing, check out our Fantasy Baseball Template.
Open Free Fantasy Football Stats Template
Related Content
- Next gen NFL stats in a spreadsheet
- Pybaseball data in a spreadsheet
- yfinance data in a spreadsheet
- Top 5 python spreadsheets
- Best Excel alternative for big data
- Best Google Sheets replacement
Appendix: Python Code
import pandas as pd
import plotly.graph_objects as go
import nfl_data_py as nfl

def get_seasonal_data(year):
    year_list = []
    year_list.append(int(year))
    df = nfl.import_seasonal_data(year_list)
    id_df = nfl.import_ids()
    id_df = id_df[['gsis_id','name']]
    df = pd.merge(df,
                     id_df,
                     left_on = 'player_id',
                     right_on = 'gsis_id',
                     how ='left')
    cols = df.columns.tolist()
    cols = cols[-1:] + cols[:-2]
    df = df[cols]
    df = df.sort_values('name')

    return df

def get_weekly_data(year):
    year_list = []
    year_list.append(int(year))
    df = nfl.import_weekly_data(year_list)

    return df

def get_play_by_play_data(year):
    year_list = []
    year_list.append(int(year))
    df = nfl.import_pbp_data(year_list)

    return df

def get_weekly_roster_data(year):
    year_list = []
    year_list.append(int(year))
    df = nfl.import_weekly_rosters(year_list)

    return df

def get_ngs_data(stat_type, year):
    year_list = []
    year_list.append(int(year))
    df = nfl.import_ngs_data(stat_type, year_list)

    return df

def get_ftn_data(year):
    year_list = []
    year_list.append(int(year))
    df = nfl.import_ftn_data(year_list)

    return df