Try the yfinance spreadsheet template
yfinance is a popular open source Python library that provides free access to financial data on Yahoo Finance. The yfinance package allows users to write simple Python commands and pull a wide range of financial data, like stock ticker data, options, fundamental financials, and much more, into a notebook, spreadsheet, or development environment. In the following tutorial, we show you how to use the most common yfinance Python commands to pull financial data into to a spreadsheet where you can analyze, chart, and track stock tickers, ETFs, crypto, bonds, options, etc. You can access your own personal yfinance template with a few pre-built functions in our yfinance spreadsheet template.

Continue reading for full instructions or jump to any of the following sections.
- Install the yfinance Python Package
- Import Historical Ticker Data For One Stock
- Modify Timeframe
- Import Historical Ticker Data for Multiple Stocks
- Import Company Fundamentals
- Options Data
- Institutional Holders
- Pros and Cons of yfinance
- Conclusion
- Appendix
Install the yfinance Python Package
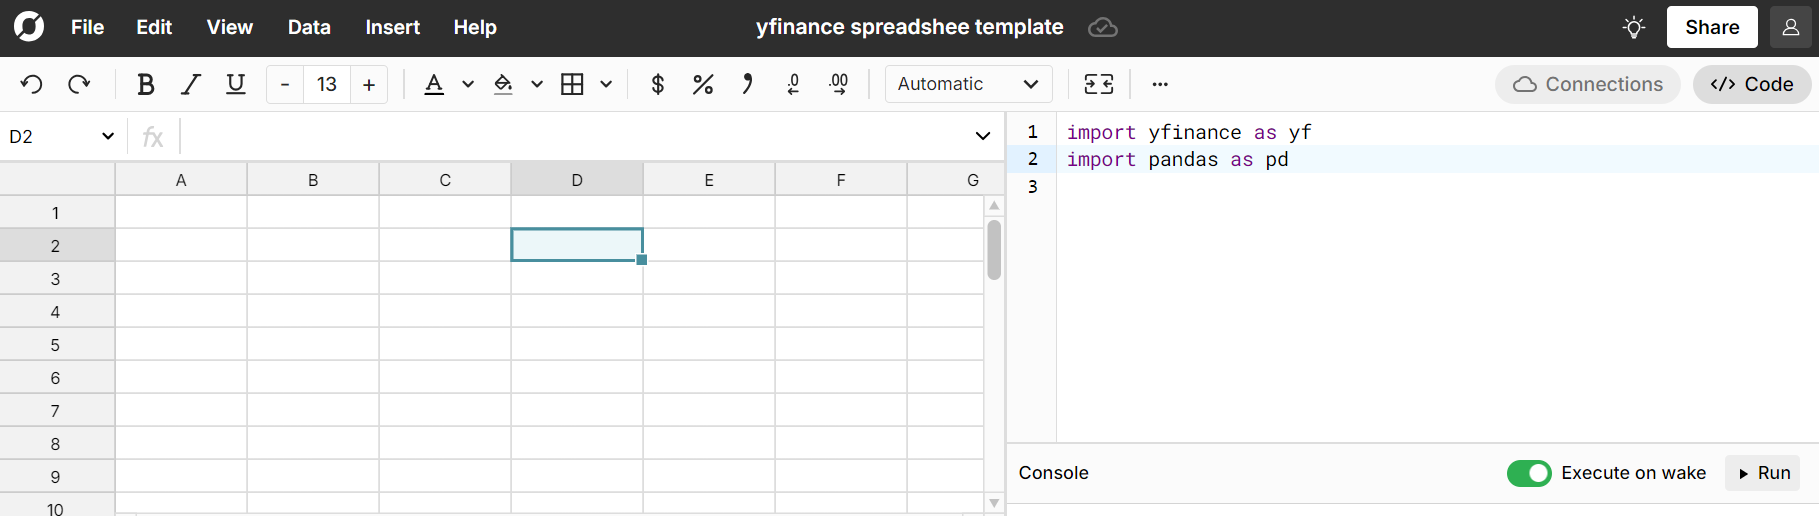
Using the yfinance api in a spreadsheet makes it easy to execute commands and further analyze financial data with simple spreadsheet formulas. Unlike Jupyter notebooks or a code editor, you do not need to worry about running a Python environment. Row Zero, a powerful online spreadsheet, takes care of all the complexity. To start, open the free yfinance template spreadsheet which includes each of the yfinance examples below. Next, open the Row Zero Python code window using the right side menu. If building from scratch, you'll need to first import the the yfinance library with the command import yfinance as yf and execute the code window by pressing shift + enter or clicking the 'run' button. In the template, the code is already written for you but you should still run the code window.
import yfinance as yf
import pandas as pd
Import Historical Ticker Data For One Stock
The first and most basic thing to do with yfinance is import historical ticker data for a specific stock ticker. For example, if we wanted to know Tesla's stock price since the IPO, the functions below let us pull that data into the spreadsheet. The same can be done for any other stock ticker, ETF, Bitcoin, or anything with a yf ticker. Using this function will pull in the date, opening price, high, low, closing price, volume of shares traded, dividends, and stock splits for every day of trading. In the example of Tesla, the data goes all the way back to the IPO on June 29, 2010 when shares began trading at $1.267.
To start, define a python function that accepts a ticker symbol argument and returns the stock's price history. The yf.Ticker function is used in this example and is one of the most popular yfinance functions. Run the code with shift + enter. There are a number of additional arguments that can be used with the yfinance history() command. Review the appendix at the end of this post for more details.
import yfinance as yf
import pandas as pd

def STOCK(ticker):
    return yf.Ticker(ticker).history(period="max")
Now use that function in the spreadsheet by typing the function with a ticker in any cell and hitting enter. 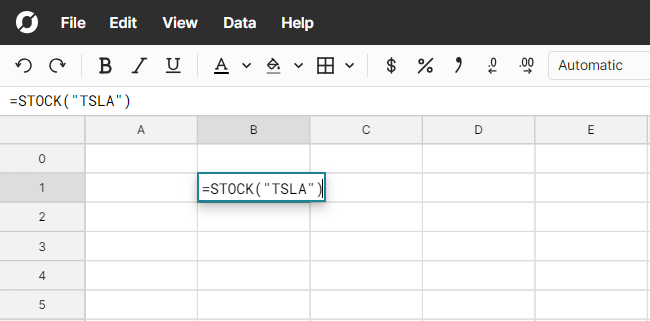
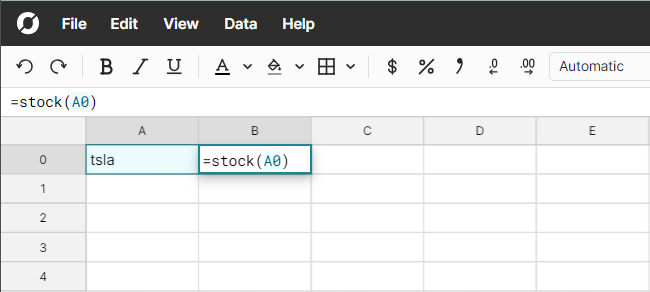
You can also type a ticker in a cell and reference the cell in the formula.
=stock(A0)
The following data table will be returned using both methods, which shows Tesla's daily stock price since IPO.
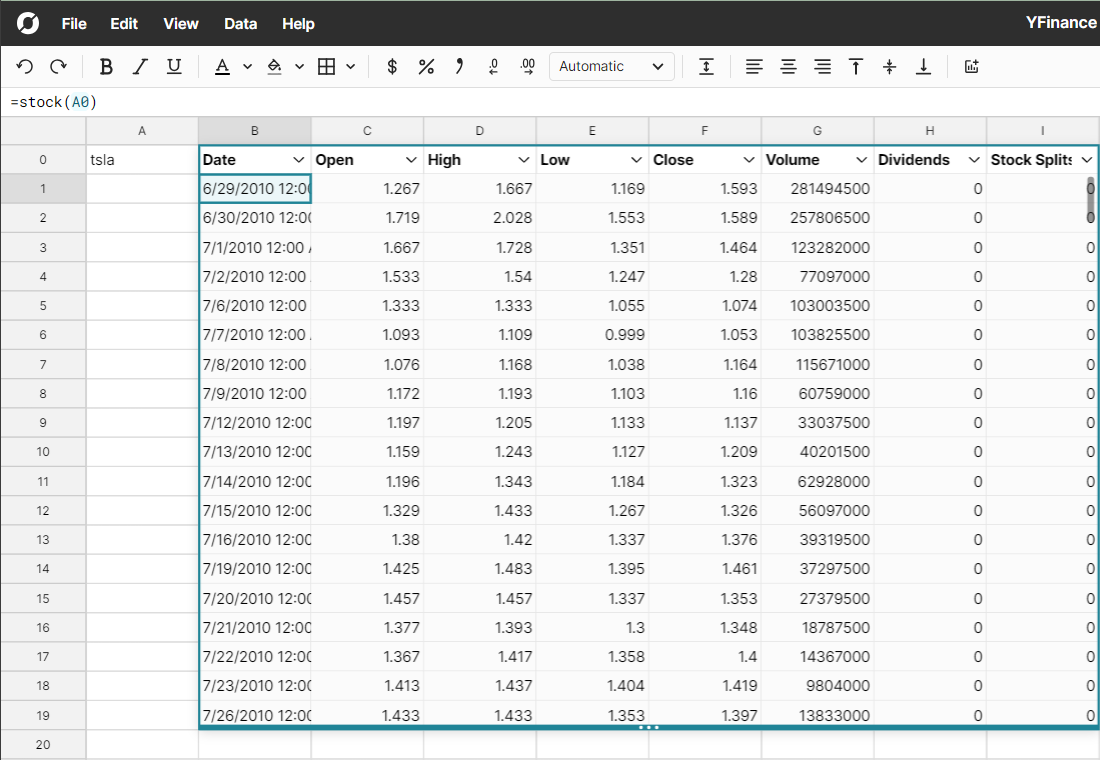
You can easily graph it and look at the trend over time. 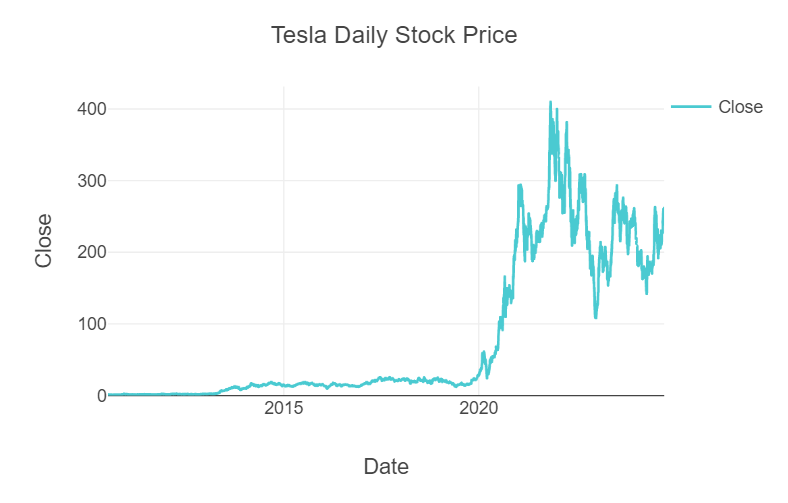
Modify Timeframe
yfinance supports various arguments that allow users to specify certain time periods that are applicable to the analysis or dataset they are trying to build. These arguments can be added to functions to modify the amount or range of data returned. Below we review modifying the timeframe for the yf ticker command and use Row Zero's column modification feature to reduce the number of viewable columns. In the Tesla example, if we only wanted to see the ticker data for the past 100 days or 1 year, we could use additional arguments to specify the time period with yfinance.
Set Period in yfinance
Update the python command and specify a different period to import the last X days of data.
def STOCK(ticker):
    return yf.Ticker(ticker).history(period="100d")
Another easy option is to use Row Zero's filters by clicking on the drop down at the top of a column and entering a filter by date. 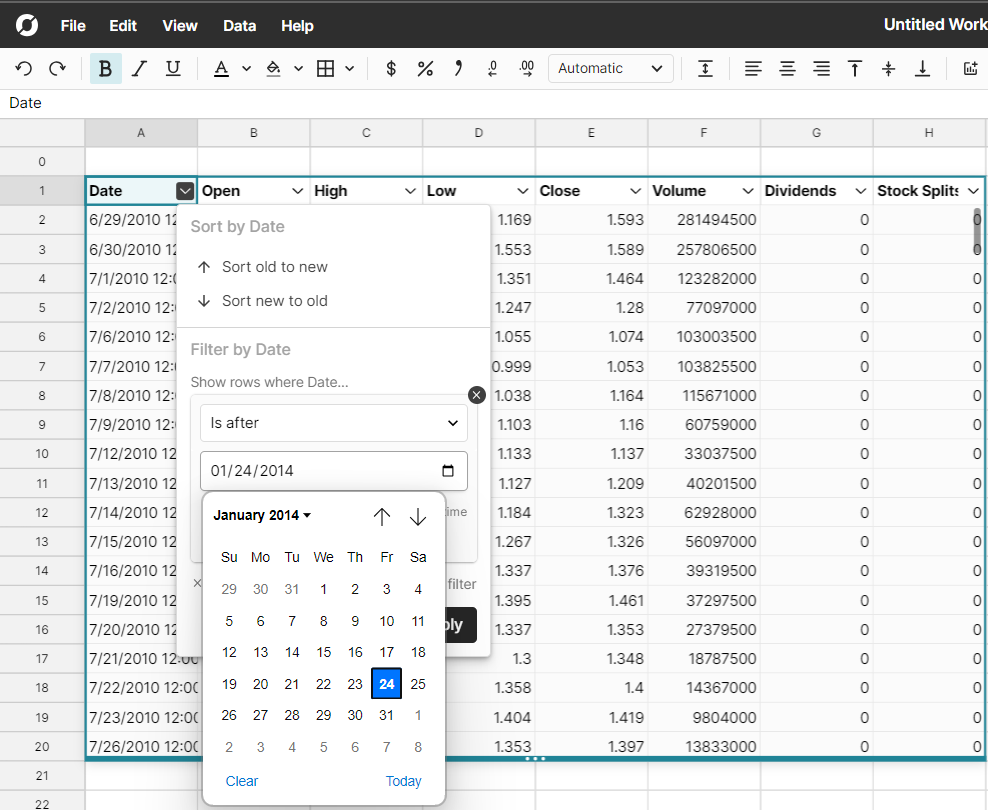
Modify columns
Once the data has been imported to Row Zero, right click and select 'manage columns' to remove columns of data that aren't needed. 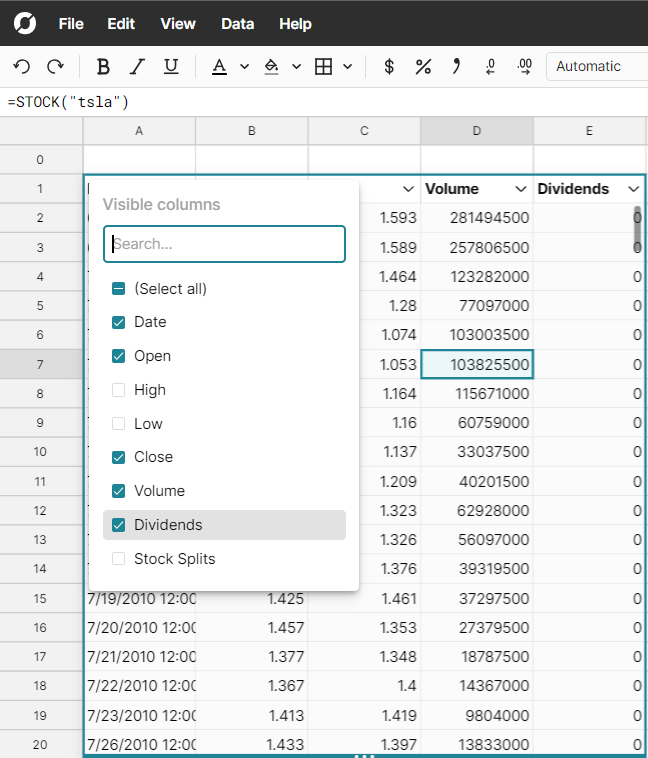
Import Historical Ticker Data for Multiple Stocks
Now that we know how to import data for one ticker, the function can be applied to multiple tickers. To import data for multiple yf tickers, use the download() command in yfinance. The parameters for download() can be found at the end of this post.
Use the following command to write a function that imports the closing price for a number of stock tickers. In this yfinance example, it is important to set the groupby parameter to either column or Ticker based on the desired structure of the data table.
def get_stock_prices(tickers):
    data = yf.download(list(tickers), group_by='column', period="1000d", interval='1d')
    return data[['Close', 'Volume']]
get_stock_prices can be used in Row Zero to reference cells with tickers of interest. See the images below for an example. 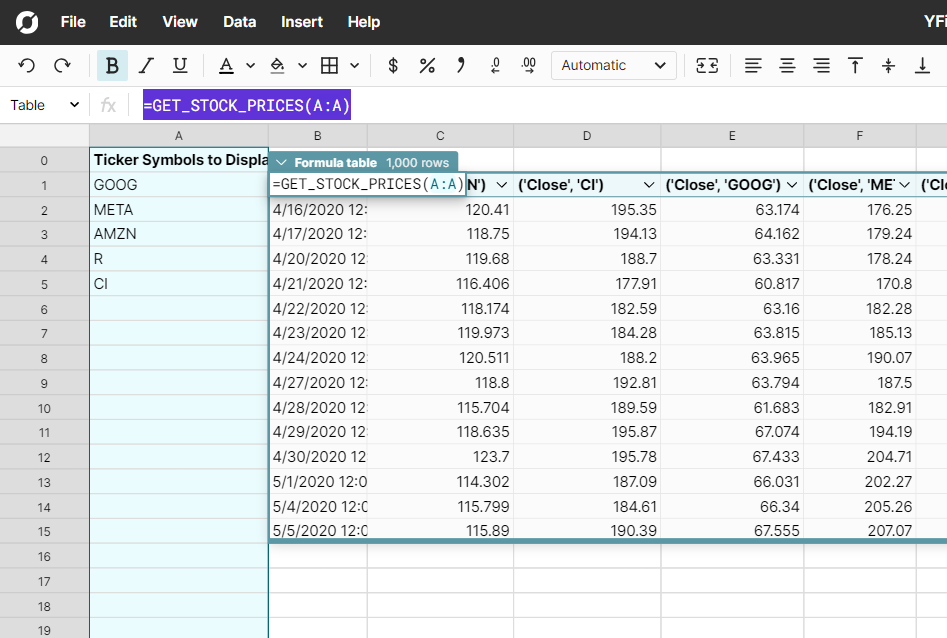
After hitting enter, the function will return the following data table: 
Graph your data
Row Zero makes it easy to quickly chart stock data. Rather than having to use complicated code based graphing libraries, simply point and click to graph your data. Row Zero graphs auto update as source data updates. As an example, select the date and close columns from the data table and then click the graph button. 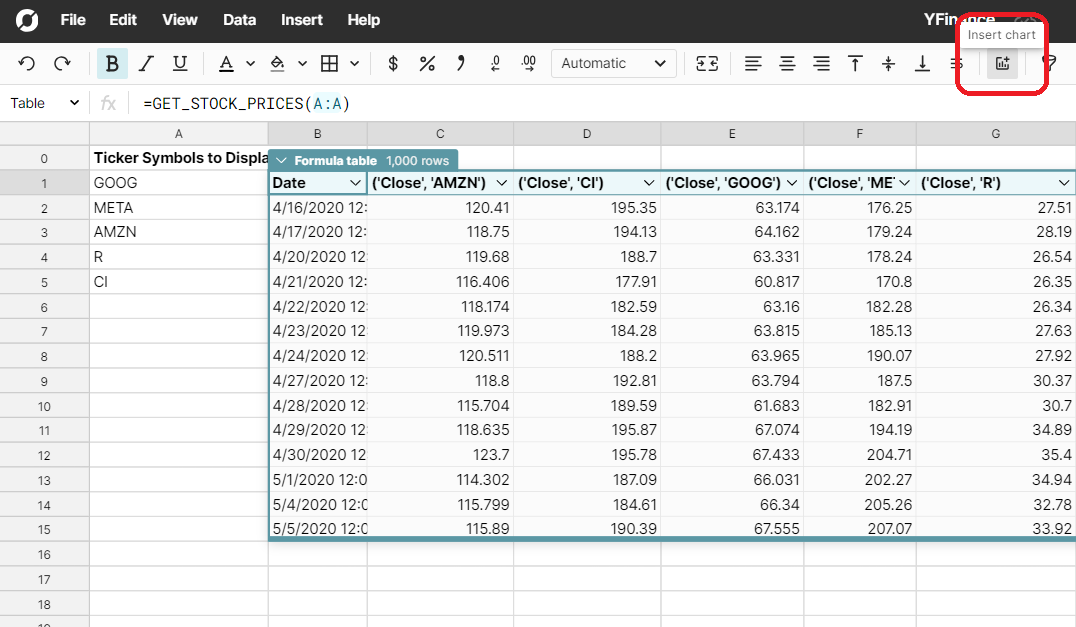
Your graph will appear and can be customized by double clicking on it. 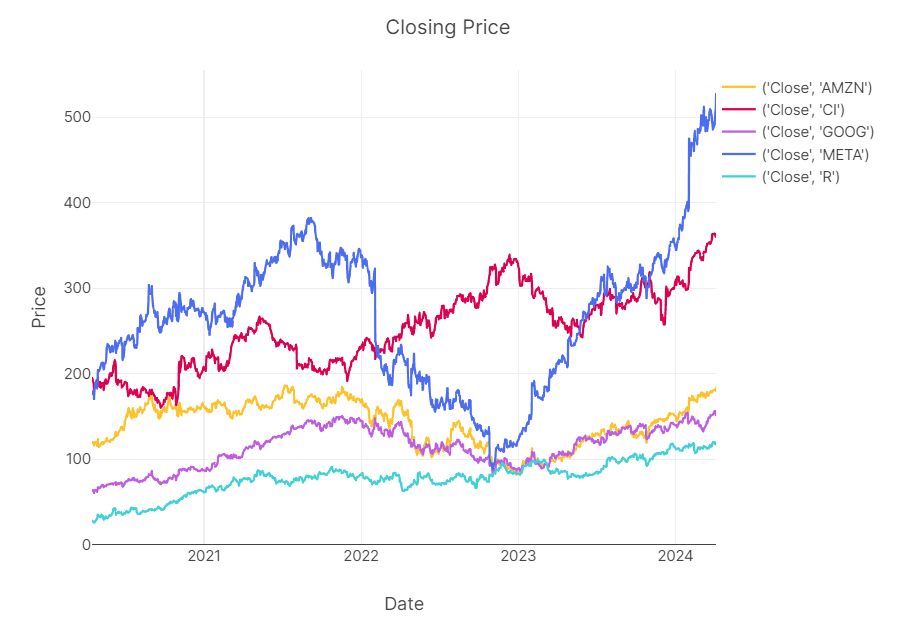
Import Company Fundamentals
Stock fundamentals refer to the core financial data and performance metrics of a company. Investors use fundamental data to analyze a company's financial health and intrinsic value. Fundamentals include revenue, earnings, profit margins, and growth rates, as well as more complex metrics like price-to-earnings (P/E) ratio, return on equity, and debt-to-equity ratio. In the case of Tesla, fundamentals might show revenue growth, which has been significant due to rising sales of electric vehicles, or its P/E ratio, which reflects investors' high expectations for future growth. An investor would also consider Tesla's operational efficiency, market share in the electric vehicle industry, and its ability to innovate and sustain profitability in a competitive market. The instructions below show how to use yfinance to pull fundamental data for one ticker or multiple yf tickers.
Fundamentals for one ticker
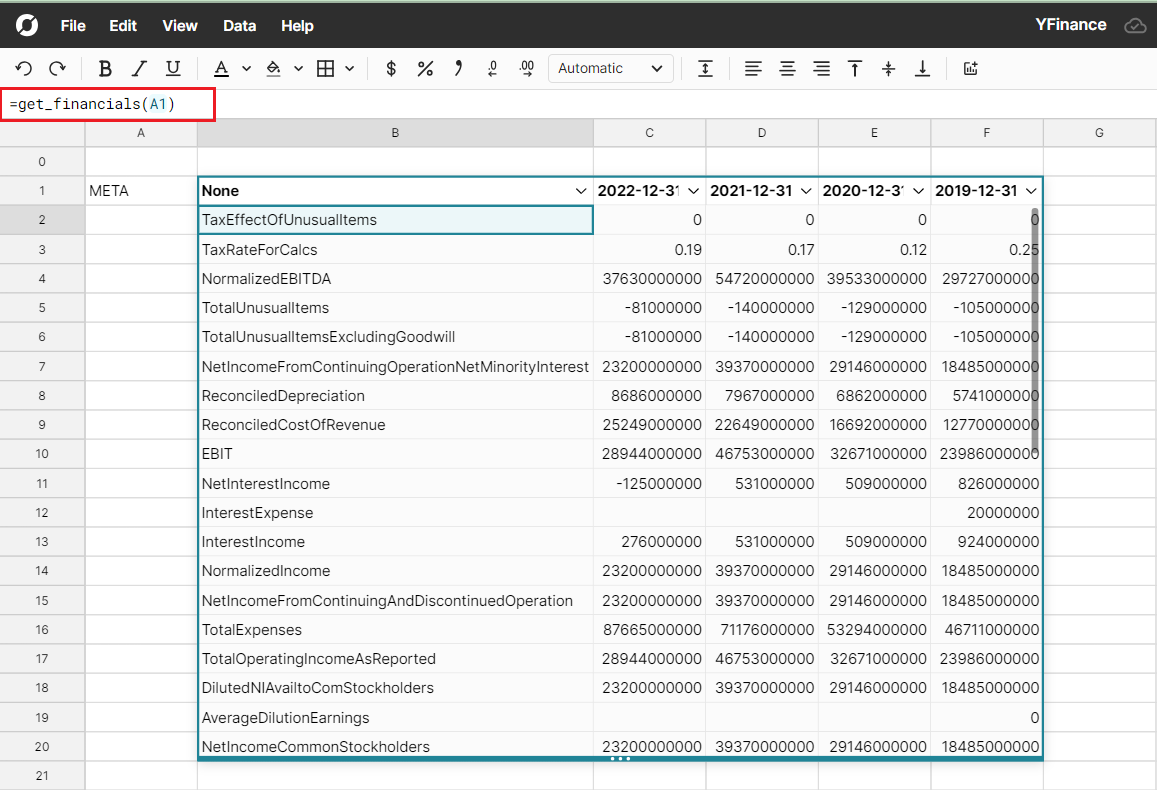
Yfinance makes it easy to gather fundamental data for various companies using get_financials(). Using the Python function below, pass in a ticker and the function will pull the fundamental data into the spreadsheet.
def get_financials(ticker):
    tck = yf.Ticker(ticker)
    return tck.get_financials()
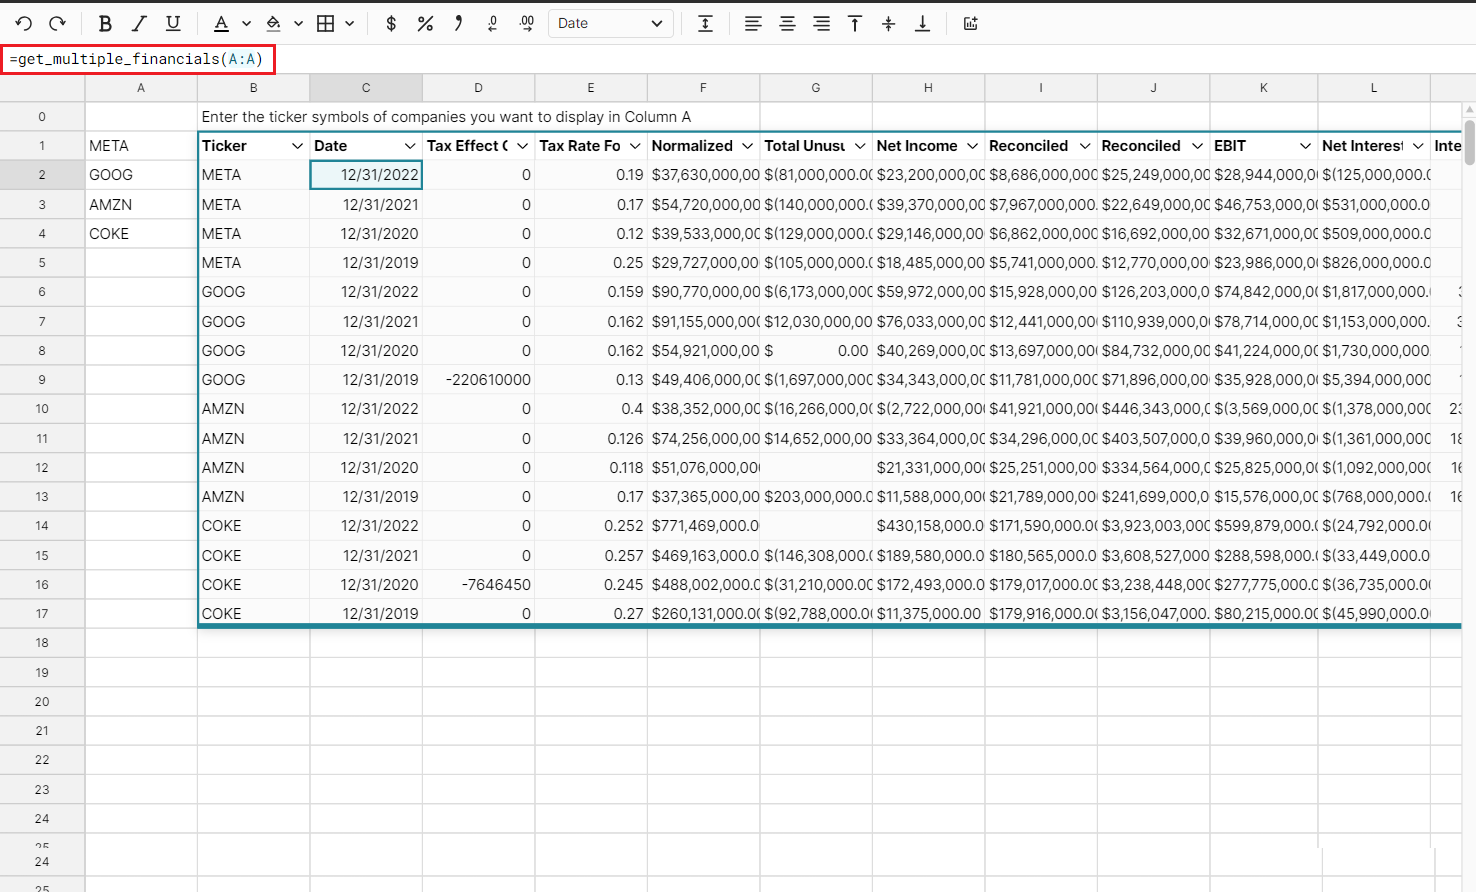
Fundamentals for multiple tickers
It may be more helpful to pull fundamental data for multiple companies at once. Do to so, use the get_multiple_financials() function which expects multiple tickers and will return results for all tickers in the selected range. The python code for this function can be found in the Appendix
Options Data
yfinance also provides options data for a given ticker symbol with another set of commands. Options data refers to details of options contracts in financial markets. These contracts give the holder the right, but not the obligation, to buy or sell an underlying asset, like a stock, at a predetermined price within a specific timeframe. Key options data include the strike price, expiration date, premiums, and whether the option is a 'call' (betting the asset price will rise) or 'put' (betting the price will fall). Options data can also include the trading volume and open interest for specific contracts, which help investors gauge market sentiment and potential price movements of the underlying asset. The following instructions show how to pull options data from the open source yfinance library.
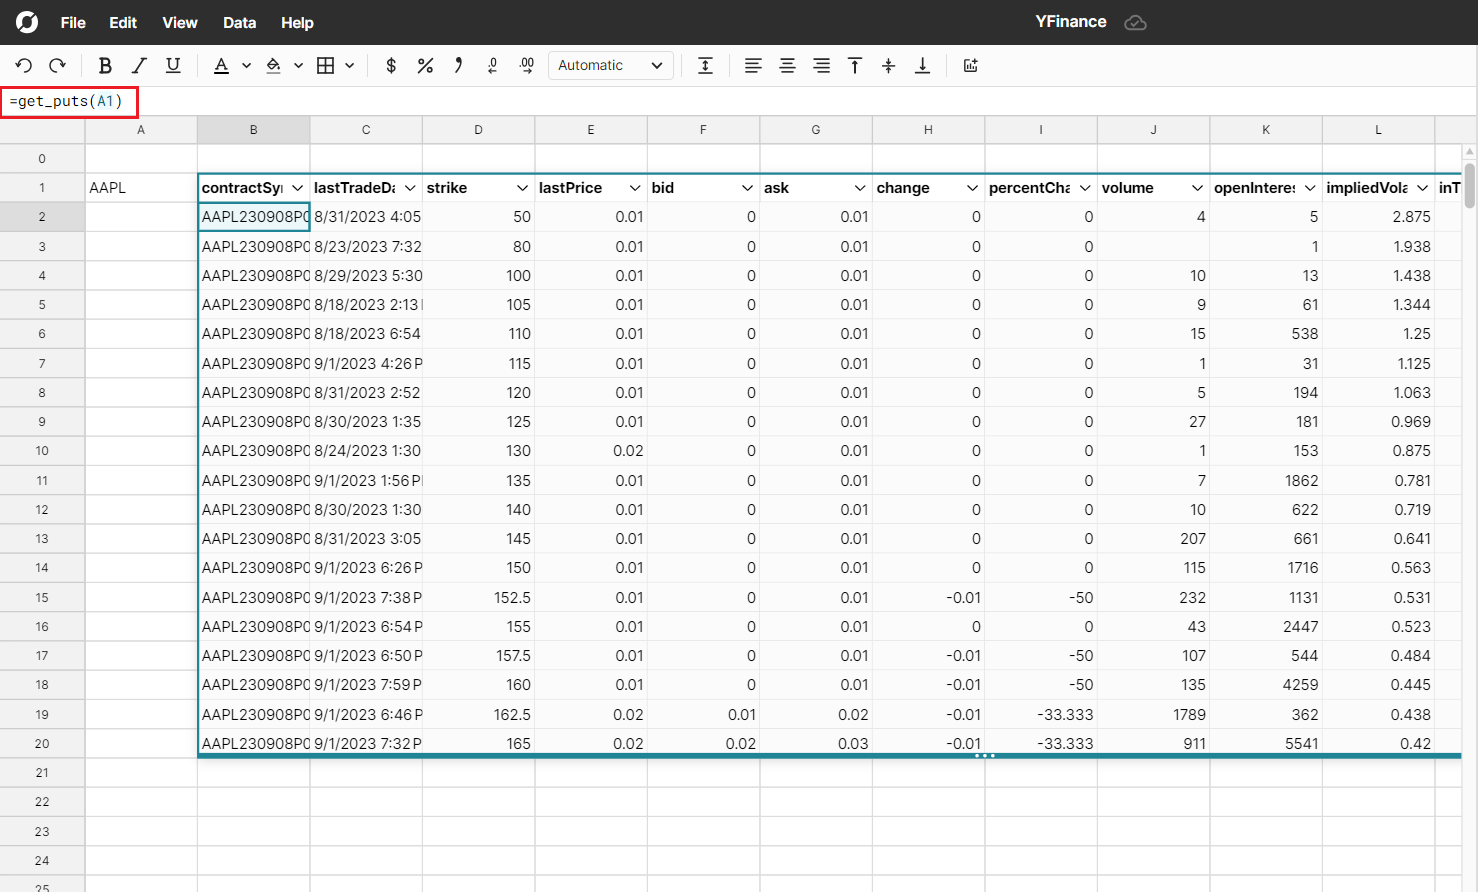
Get puts for one stock ticker
It is easy to get options data using options.puts and options.calls. Python code can be found in the Appendix.
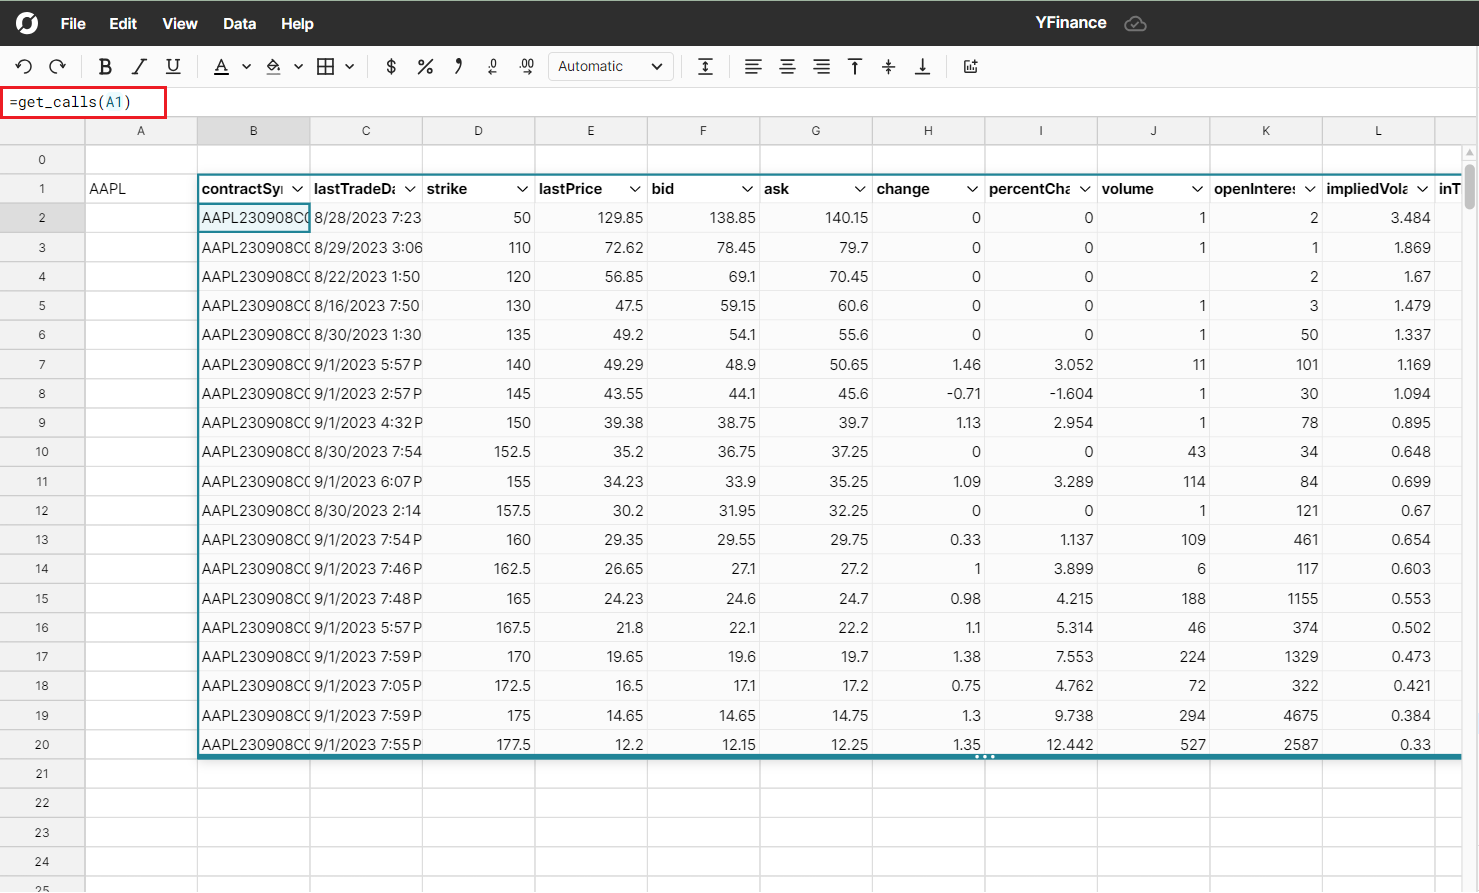
Get calls for one stock ticker
The get_calls() function passes a ticker and returns the calls associated with the ticker. Python code can be found in the Appendix.
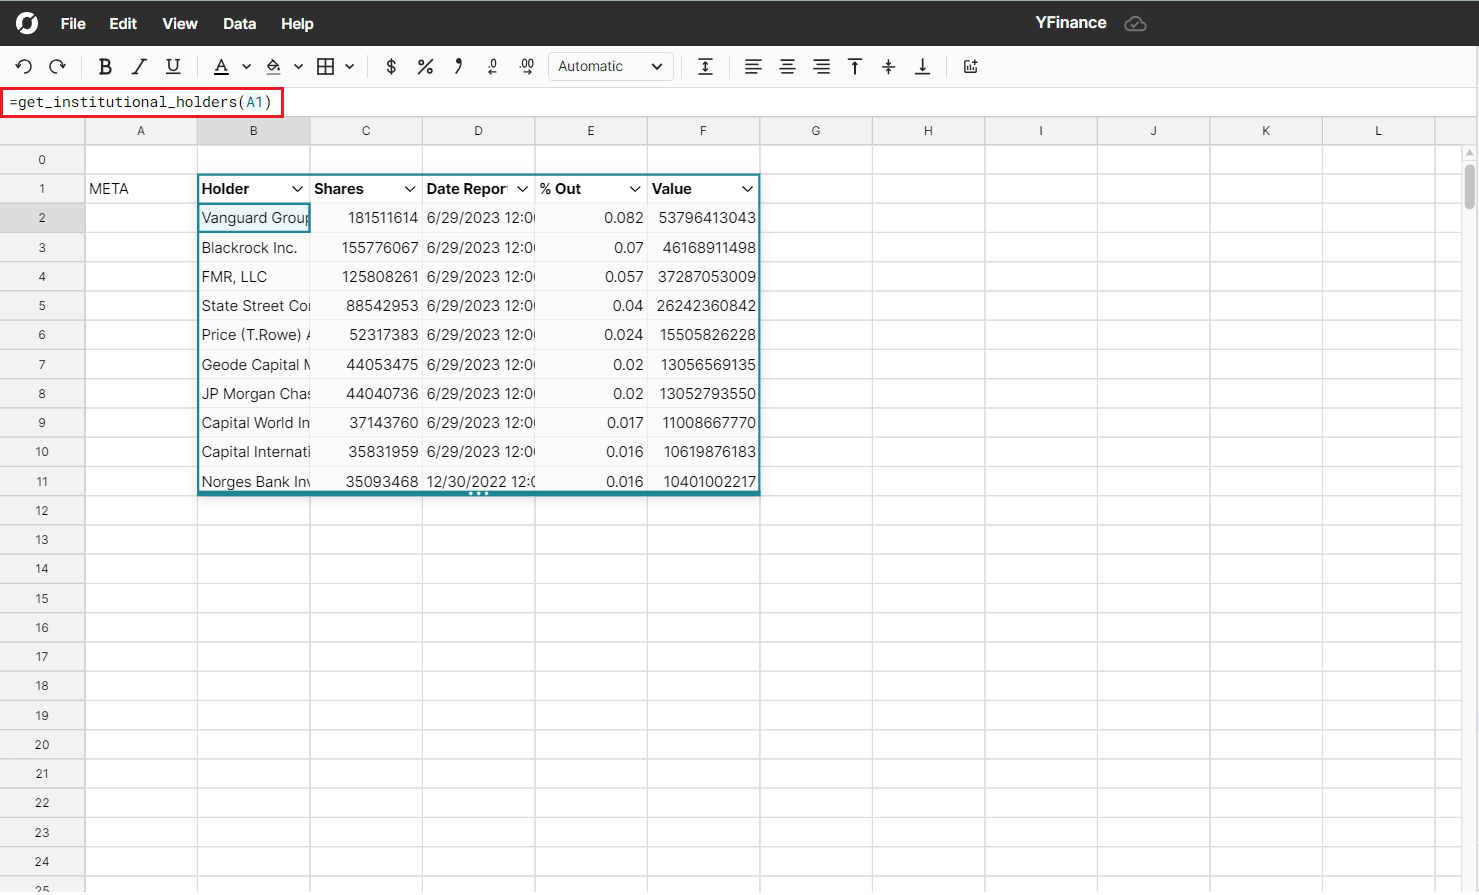
Get Institutional Holders
Institutional holders are entities like mutual funds, pension funds, insurance companies, investment firms, and other large organizations that invest in sizable quantities of shares. The yfinance API has a function that will provide information on the institutional holders of a specified stock ticker, making it easy to pull the data into Row Zero. Use get_institutional_holders() to import this data. Python code can be found in the Appendix.
Track Crypto, ETFs, Bonds, etc.
The yfinance python package supports any tickers on Yahoo Finance including crypto like Bitcoin and Ethereum, ETFs like QQQ, SPY, and SCHD, as well as bonds, and other financial instruments. If your investments are diversified across these tickers, you can build one common investment portfolio tracker spreadsheet to track crypto prices, stocks, ETFs, etc.
Pros and Cons of yfinance
yfinance is a great free tool for analyzing financial data but there are a few pros and cons to consider. Below we review the pros and cons of the open source yfinance Python package.
Pros:
- yfinance is free. There are a few other free financial data sources but they are less widely used. Paid data sources are very expensive (Bloomberg costs $24,000/year)
- User-friendly. The open source package is easy to install and use. Pypi reports several hundred thousand installs each month.
- Valuable data. yfinance exposes data for strategic investing decisions and lets you track stocks and ETFs or analyze your investment portfolio.
Cons:
- Dependencies. yfinance can break if Yahoo Finance ever changes the format of their site. If this were to happen, it is likely the yfinance library would be updated to remedy the situation but access to data may incur a short disruption.
- Data frequency. The highest frequency data is minute level, which makes yfinance a less suitable option for real-time trading.
- Reliability. Paid data sources typically offer higher fidelity data from more reliable access points, like terminals and APIs.
- Python skills. While very accessible to many, the yfinance python package requires basic knowledge of Python. Hopefully, this yfinance tutorial makes it easier for beginners. Non-technical users can start with our yfinance template spreadsheet which has yfinance examples and pre-built code to start working with yfinance in a spreadsheet even if you don't know Python.
Conclusion
Yfinance is a great free resource for pulling and analyzing stock data. It's easy to pull stock prices, fundamentals, options data, and institutional holders among many other options. There are pros and cons. The pros center on its ease of use and its free price tag. The cons mainly center on reliability, data frequency, and a need to know basic Python. If your preference is to work with financial data in a spreadsheet, or you need help getting started with yfinance, use the yfinance spreadsheet template to pull ticker data straight into a spreadsheet and begin your analysis.
Try the yfinance spreadsheet template
Appendix
This section includes additional information about parameters for popular functions available in the yfinance python library. Reference these lists to expand upon the history() and download() functions provided above. There is also additional information and yfinance python documentation on the pypi yfinance page.
Entire Code Window for Yfinance Workbook
import yfinance as yf
import pandas as pd

def STOCK(ticker):
    return yf.Ticker(ticker).history(period="max")

def get_stock_prices(tickers):
    data = yf.download(list(tickers), group_by='column', period="1000d", interval='1d')
    return data[['Close', 'Volume']]

def get_financials(ticker):
    tck = yf.Ticker(ticker)
    return tck.get_financials()

def get_multiple_financials(tickers):
    tickers = [yf.Ticker(ticker) for ticker in tickers]
    dfs = [] # list for each ticker's dataframe
    for ticker in tickers:
        # get each financial statement
        pnl = ticker.financials
        bs = ticker.balancesheet
        cf = ticker.cashflow

        # concatenate into one dataframe
        fs = pd.concat([pnl, bs, cf])

        # make dataframe format nicer
        # Swap dates and columns
        data = fs.T
        # reset index (date) into a column
        data = data.reset_index()
        # Rename old index from '' to Date
        data.columns = ['Date', *data.columns[1:]]
        # Add ticker to dataframe
        data['Ticker'] = ticker.ticker
        dfs.append(data)
    df = pd.concat(dfs, ignore_index=True)
    df = df.T.drop_duplicates().T
    df = df.set_index(['Ticker','Date'])
    return df

def get_calls(ticker):
    tck = yf.Ticker(ticker)
    options = tck.option_chain()
    return options.calls

def get_puts(ticker):
    tck = yf.Ticker(ticker)
    options = tck.option_chain()
    return options.puts

def get_institutional_holders(ticker):
    tck = yf.Ticker(ticker)
    return tck.institutional_holders
yfinance history() Parameters
The following are all the parameters for the history() command in yfinance.
:Parameters:
    period : str
        Valid periods: 1d,5d,1mo,3mo,6mo,1y,2y,5y,10y,ytd,max
        Either Use period parameter or use start and end
    interval : str
        Valid intervals: 1m,2m,5m,15m,30m,60m,90m,1h,1d,5d,1wk,1mo,3mo
        Intraday data cannot extend last 60 days
    start: str
        Download start date string (YYYY-MM-DD) or _datetime.
        Default is 1900-01-01
    end: str
        Download end date string (YYYY-MM-DD) or _datetime.
        Default is now
    prepost : bool
        Include Pre and Post market data in results?
        Default is False
    auto_adjust: bool
        Adjust all OHLC automatically? Default is True
    back_adjust: bool
        Back-adjusted data to mimic true historical prices
    proxy: str
        Optional. Proxy server URL scheme. Default is None
    rounding: bool
        Round values to 2 decimal places?
        Optional. Default is False = precision suggested by Yahoo!
    tz: str
        Optional timezone locale for dates.
        (default data is returned as non-localized dates)
    timeout: None or float
        If not None stops waiting for a response after given number of
        seconds. (Can also be a fraction of a second e.g. 0.01)
        Default is None.
    **kwargs: dict
        debug: bool
            Optional. If passed as False, will suppress
            error message printing to console.
yfinance Download() Parameters
The following are all the parameters for the download() command in yfinance. Each parameter can be used to specify changes in the data returned from each function.
# Download yahoo tickers
:Parameters:
    tickers : str, list
        List of tickers to download
    period : str
        Valid periods: 1d,5d,1mo,3mo,6mo,1y,2y,5y,10y,ytd,max
        Either Use period parameter or use start and end
    interval : str
        Valid intervals: 1m,2m,5m,15m,30m,60m,90m,1h,1d,5d,1wk,1mo,3mo
        Intraday data cannot extend last 60 days
    start: str
        Download start date string (YYYY-MM-DD) or _datetime.
        Default is 1900-01-01
    end: str
        Download end date string (YYYY-MM-DD) or _datetime.
        Default is now
    group_by : str
        Group by 'ticker' or 'column' (default)
    prepost : bool
        Include Pre and Post market data in results?
        Default is False
    auto_adjust: bool
        Adjust all OHLC automatically? Default is False
    actions: bool
        Download dividend + stock splits data. Default is False
    threads: bool / int
        How many threads to use for mass downloading. Default is True
    proxy: str
        Optional. Proxy server URL scheme. Default is None
    rounding: bool
        Optional. Round values to 2 decimal places?
    show_errors: bool
        Optional. Doesn't print errors if True
    timeout: None or float
        If not None stops waiting for a response after given number of
        seconds. (Can also be a fraction of a second e.g. 0.01)