Data Tables
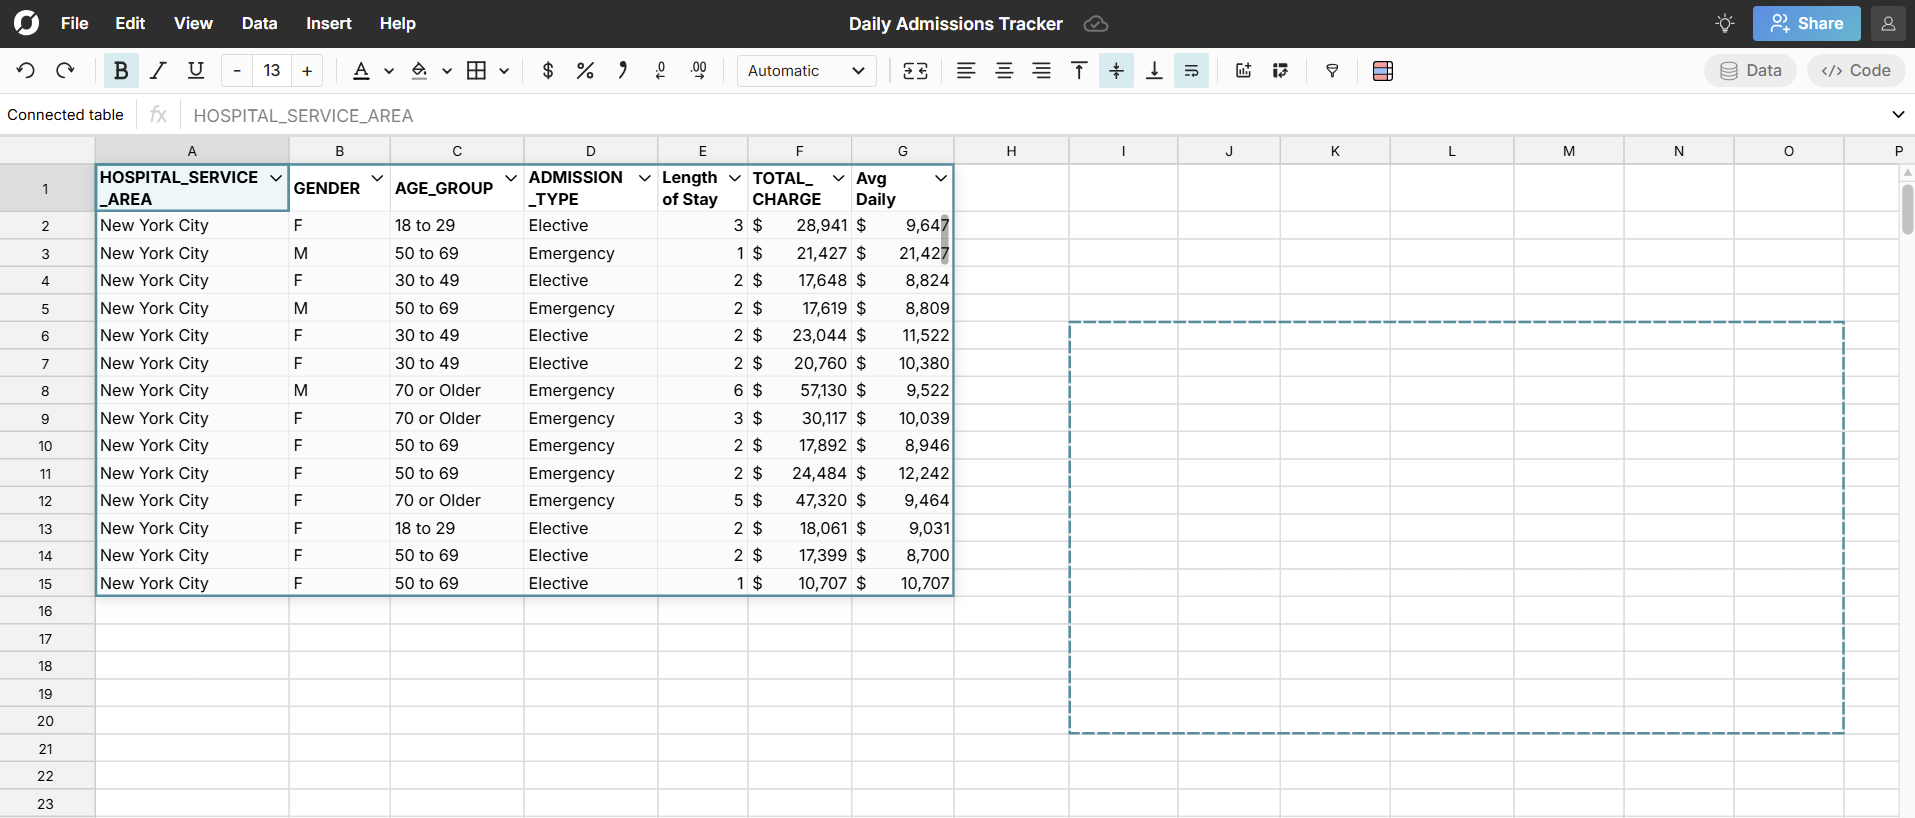
Data Tables sit on top of your spreadsheet, are anchored from the upper left most cell the data table covers, and include all the data from the imported dataset. They are a convenient way to view and manage large datasets within a spreadsheet for a number of reasons:
- Live Connections - Data tables support live connections to hosted data and can be refreshed to pull in new data. These are called Connected Tables. Pivot tables and charts can be created from data tables. When pivot tables and graphs are created from connected tables, they will update every time the connected table is refreshed with the latest data.
- Size - Data table size will not exceed the existing border even when the dataset is updated with new data. Data inside the data table can be viewed by scrolling or ctrl arrowing within the boundary. To view more or less of the data inside the table, click and drag the bottom border to increase or decrease the number of rows shown. Write formulas below or adjacent to the data table and they will update when the data updates but won't be overwritten by an expanding data set.
- Read-only - Data tables are read-only so data contained within cannot be intentionally or unintentionally overwritten.
- Transformation - Data tables support column level transformations by simply typing a formula in the spreadsheet and referencing a specific row in the data table rather than having to fill a function down for millions of rows. If working in a traditional spreadsheet mode is preferred, right-click inside the data table and select Explode table to transform the data table into spreadsheet cells where the data is fully editable.
Below we outline four types of data tables - connected tables, imported tables, pivot tables, and formula tables - along with their features.
Connected Tables
 Connected tables are data tables backed by a data source connection. Row Zero supports a number of data warehouse connectors that allow users to query their data warehouse and import data directly into a Row Zero spreadsheet. Once imported to the workbook, the data sits in a connected table, which is simply a data table backed by a data source connection. Any time the query backing the connected table is run, the data in the connected table is updated with the latest query results and everything built on top of the connected table (pivot tables, charts, formulas, etc.) also updates and stays in sync.
Creating a connected table
To create a connected table, click the Data icon near the top right of the workbook and connect to your data source. Here are instructions for connecting to Snowflake, Databricks, Redshift, BigQuery, and Postgres.
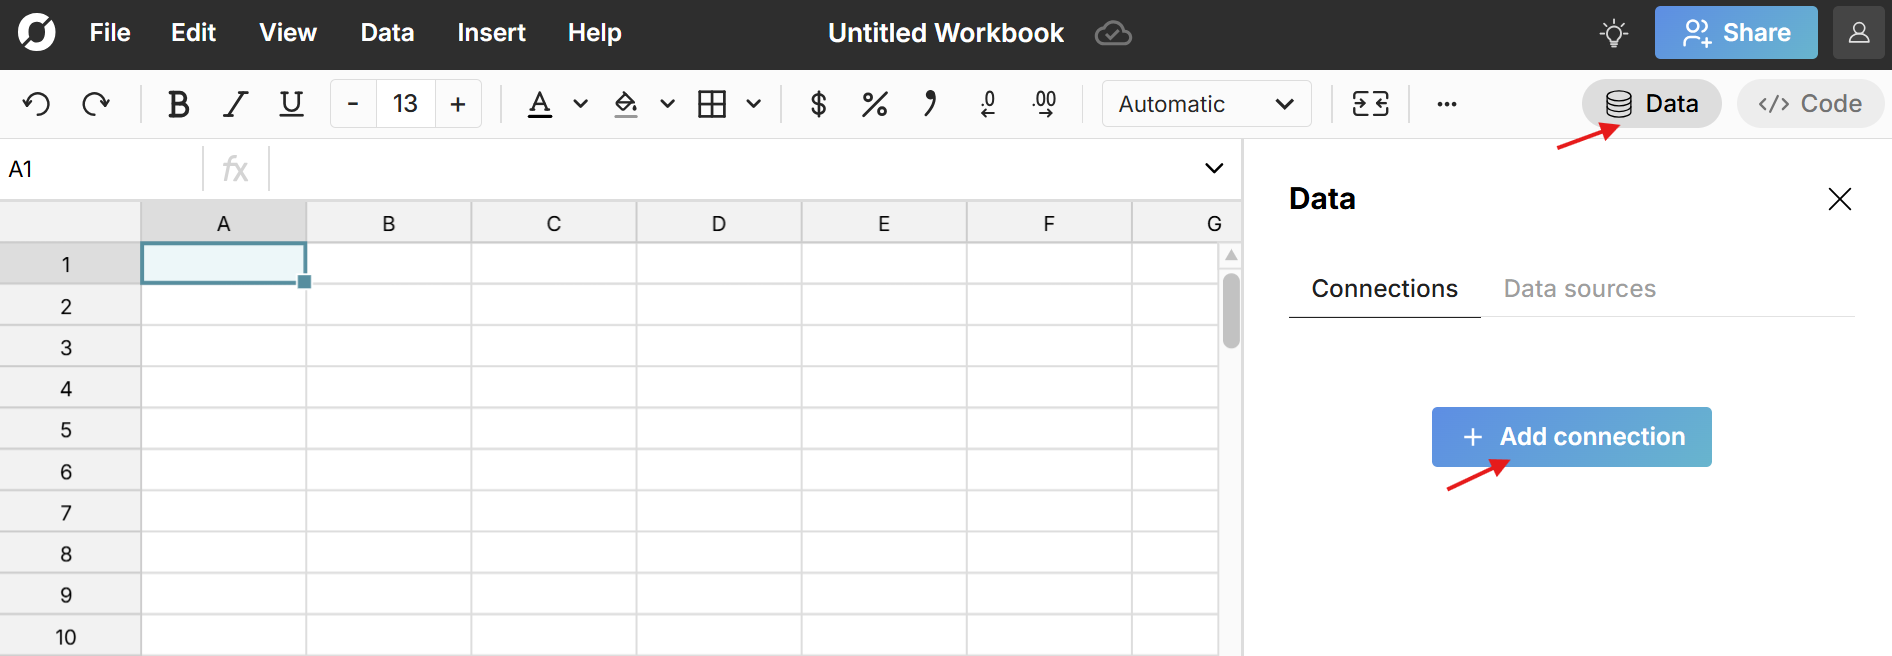
Once connected to your data source, you can insert a connected table by clicking the same Data icon and clicking the + sign next to your connected data source.
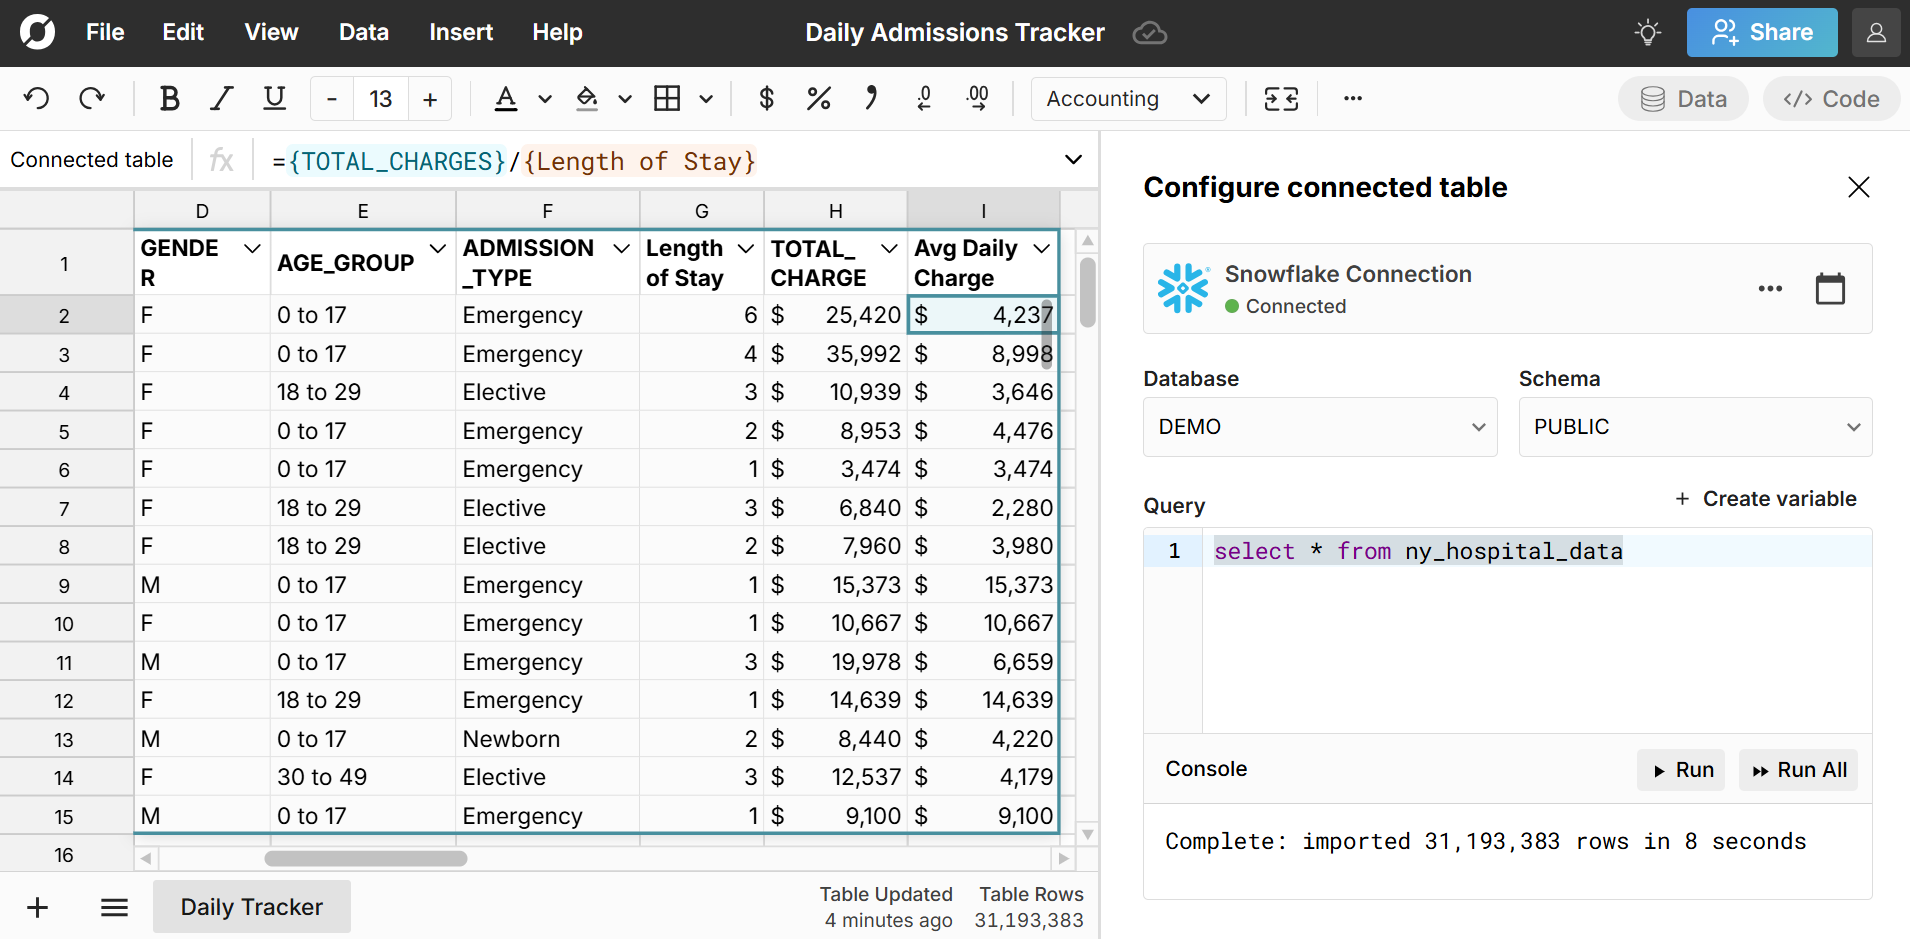
Select your database and schema, write your SQL query, and click Run to execute your query. This will create a connected table based on your SQL query and connected to your data source. Click Run at any time to re-run the query to get the latest data or schedule auto-refresh to automate updates.

Right-click to open data table menu
Right-click inside a data table to open the context menu. This provides a number of options for working with your data table, including editing your data source, managing columns, creating a pivot table, sorting and filtering, cut/copy, explode to cells, and exporting the table to CSV or a data source. 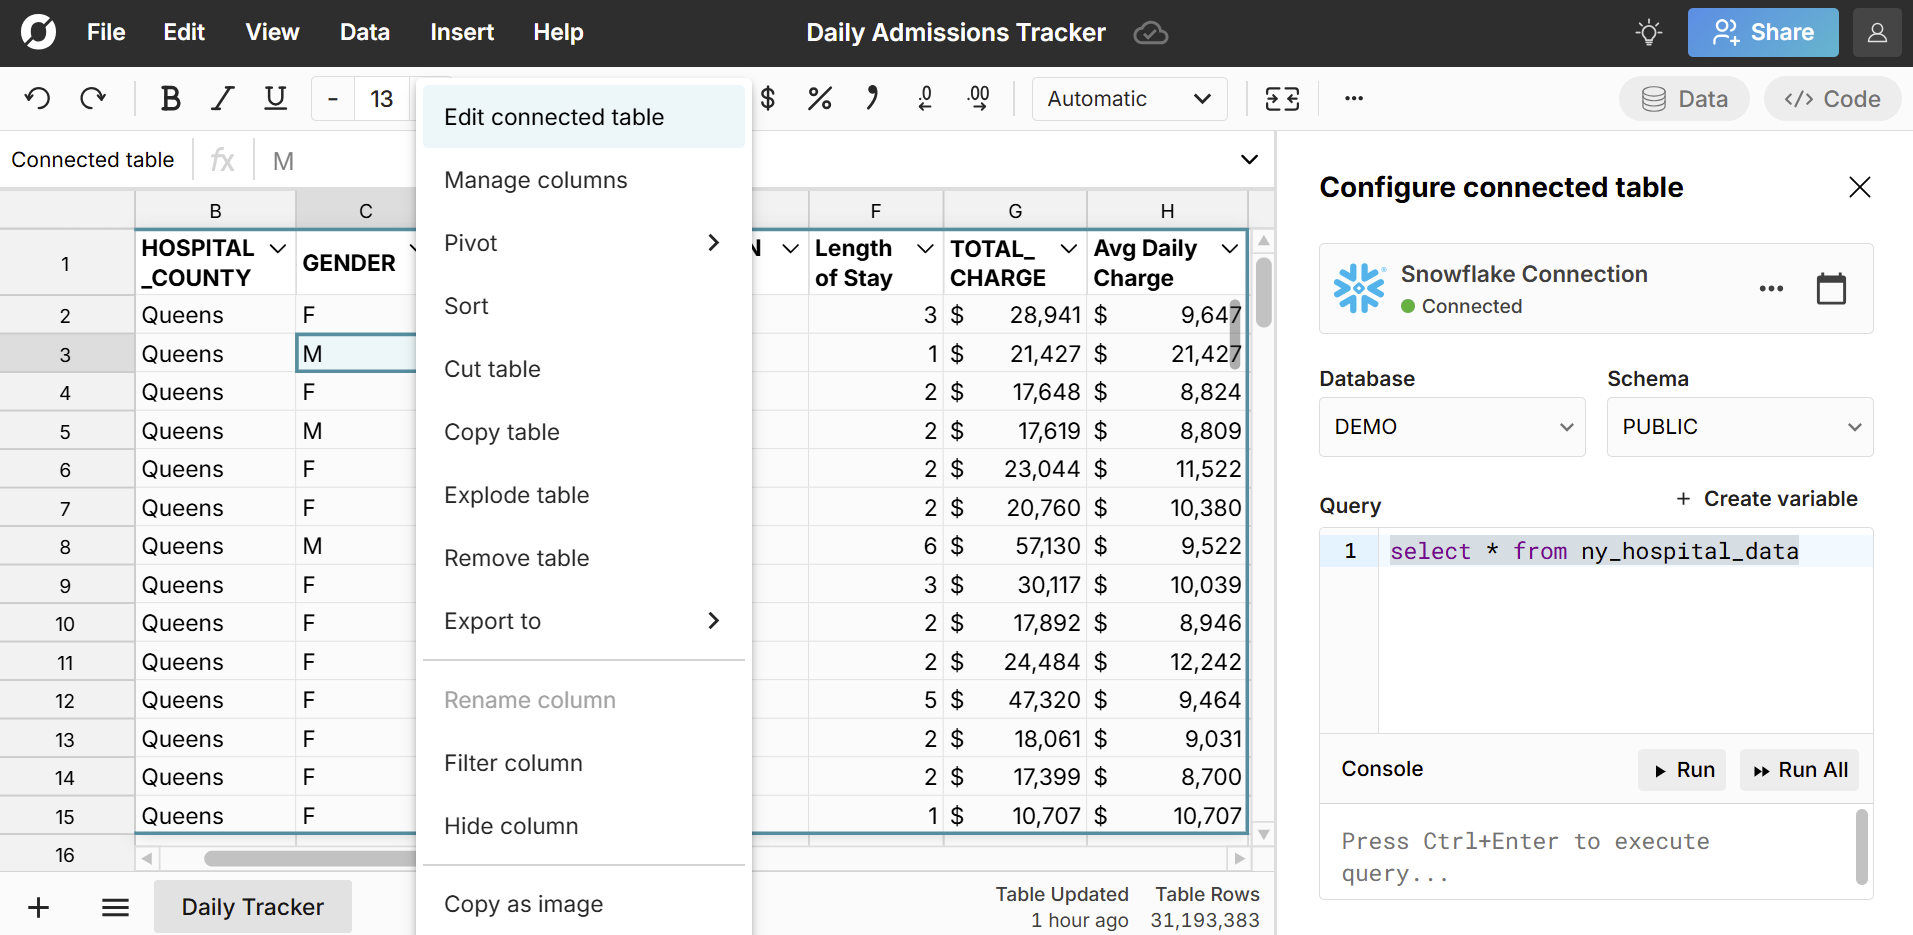 You can also double click within the data table to re-open the "Configure connected table" panel at any time.
Updating and auto-refresh
You can manually click Run to re-run your query and update your data table with the latest data. Everything built on top of your connected table will also update (pivot tables, charts, calculations, etc.). You can set up scheduled refresh to auto-update at a specific time each day. The auto-refresh control is found in the upper right corner of the data connections window and is only available to Business and Enterprise users. When the auto-refresh occurs, the query backing the data import will be re-executed and any new results from the query will populate in the table and update anything that references the table.  When you click in a connected table, you can see when it was last updated in the bottom right of the workbook, along with the number of rows in the table.
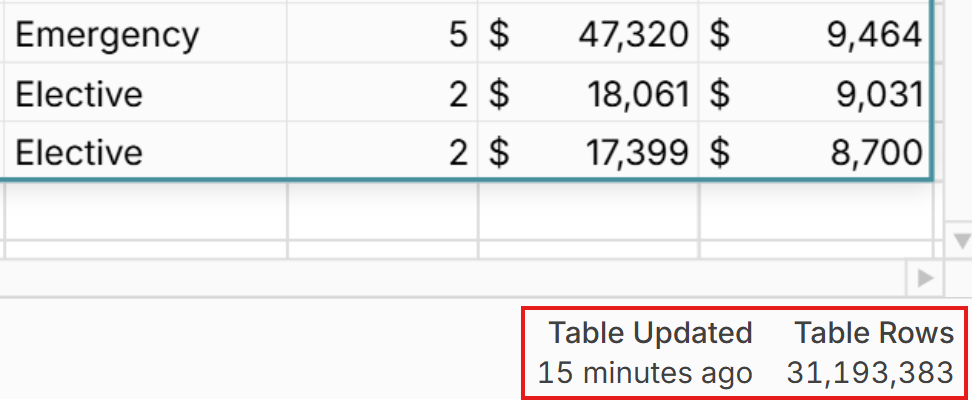
Data Table Transformations
Scroll, move, resize, and duplicate data tables
- Scroll: Click in a data table to scroll with your mouse, arrow keys, or the scroll bar on the right side of the table. Use Ctrl + arrow up to navigate to the top and Ctrl + arrow down to navigate to the bottom of the data table.
- Click and drag: Data tables can be moved within a sheet by clicking on the left, right, and top borders of the table and dragging to a new location. The hand icon will display when the mouse is hovering over a border that can be moved.
- Resize: Data tables default to 15 rows and can be expanded or contracted by dragging the bottom border of the data table to the desired size. As mentioned above, you can also right-click and explode the table to cells.
- Cut/Copy/Paste: Right-click to cut and copy data tables and paste with ctrl + v. This is an easy way to duplicate connected tables and pivot tables to quickly make new iterations.
Explode data table to spreadsheet cells
To transform a data table into spreadsheet cells, right-click on the data table of interest and select Explode table from the context menu. The data table will be pasted into the underlying cells of the spreadsheet filling all the rows populated by the data. This is similar to a copy/paste values. 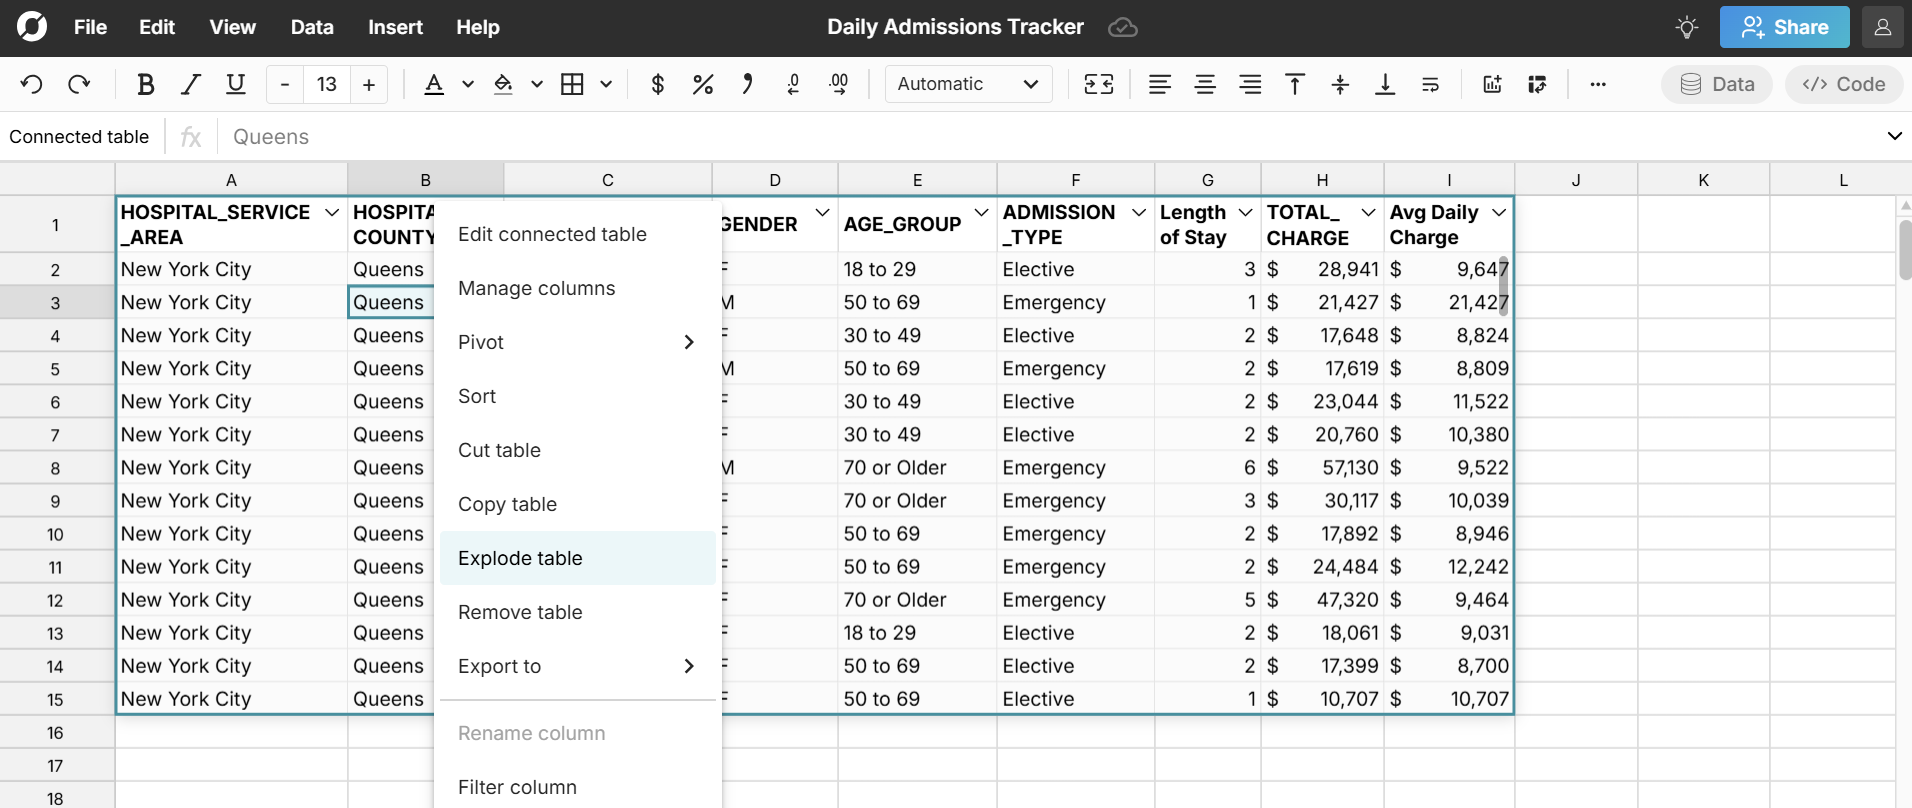 Note, when you explode a data table, you break the connection to your source data, so exploded data will not update with source data.
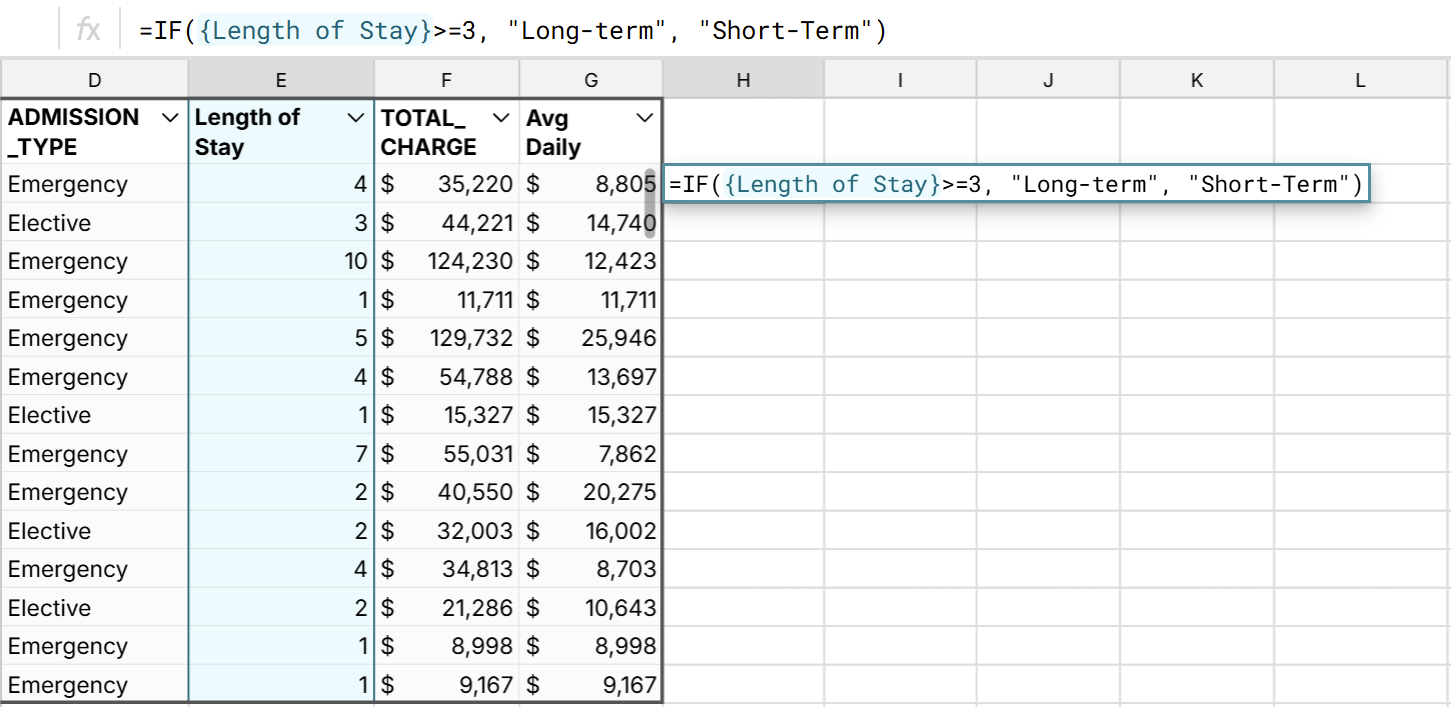
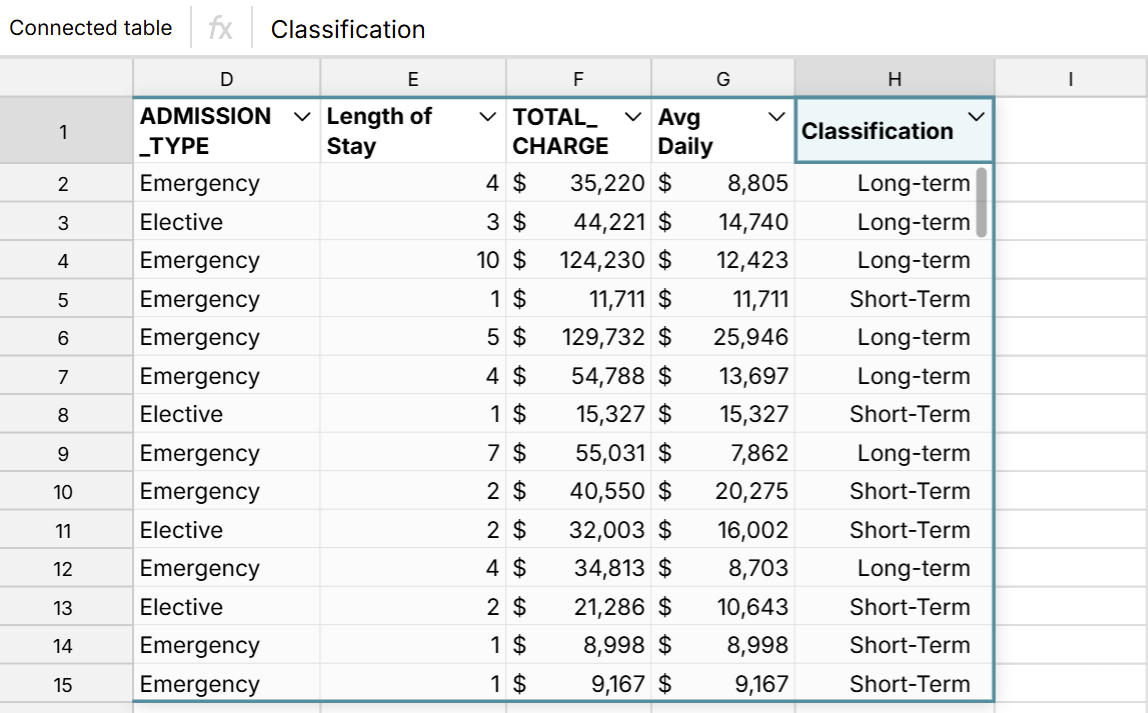
Add new columns or computed columns
Columns can be added to data tables by typing the function or transformation in the column adjacent to the data table. The function or transformation will be executed on any column selected and will produce a new column in the data table.
- Write a function
- Evaluate the function and the column is added to the data table.
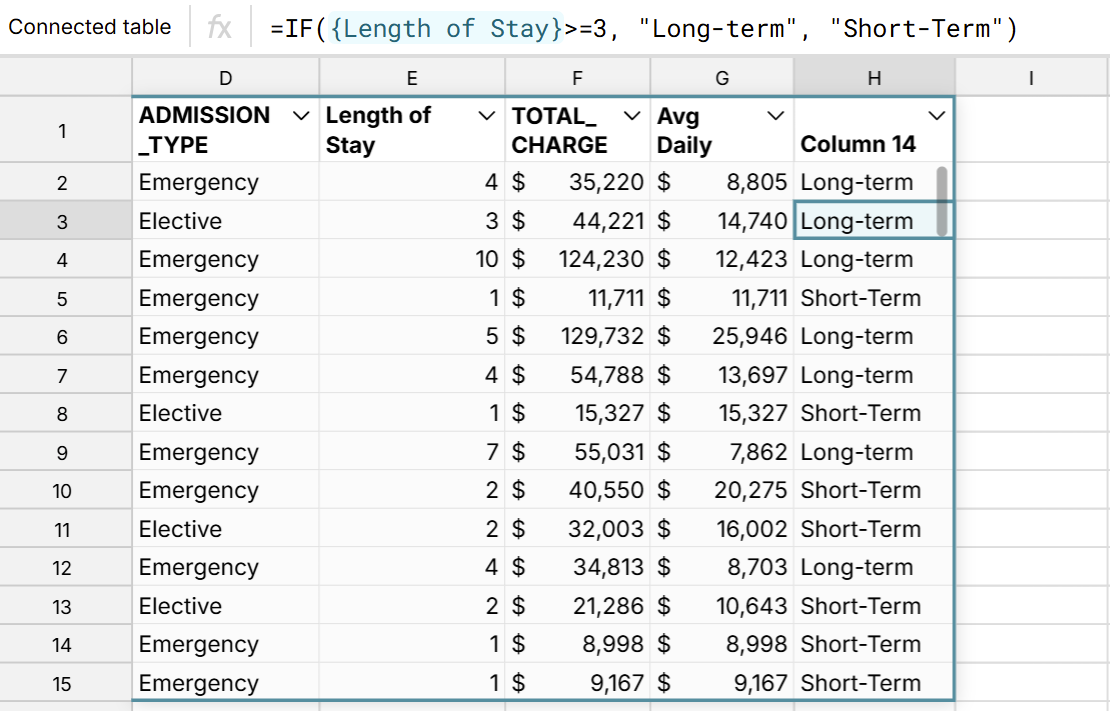
- Rename the column by editing the header cell
Manage columns to hide and re-order columns
Right-click on the data table and select Manage columns to hide and re-order columns. You can also hide and re-order calculated columns. Note that source data table columns cannot be deleted but calculated columns can be deleted by clicking in the column and hitting delete. 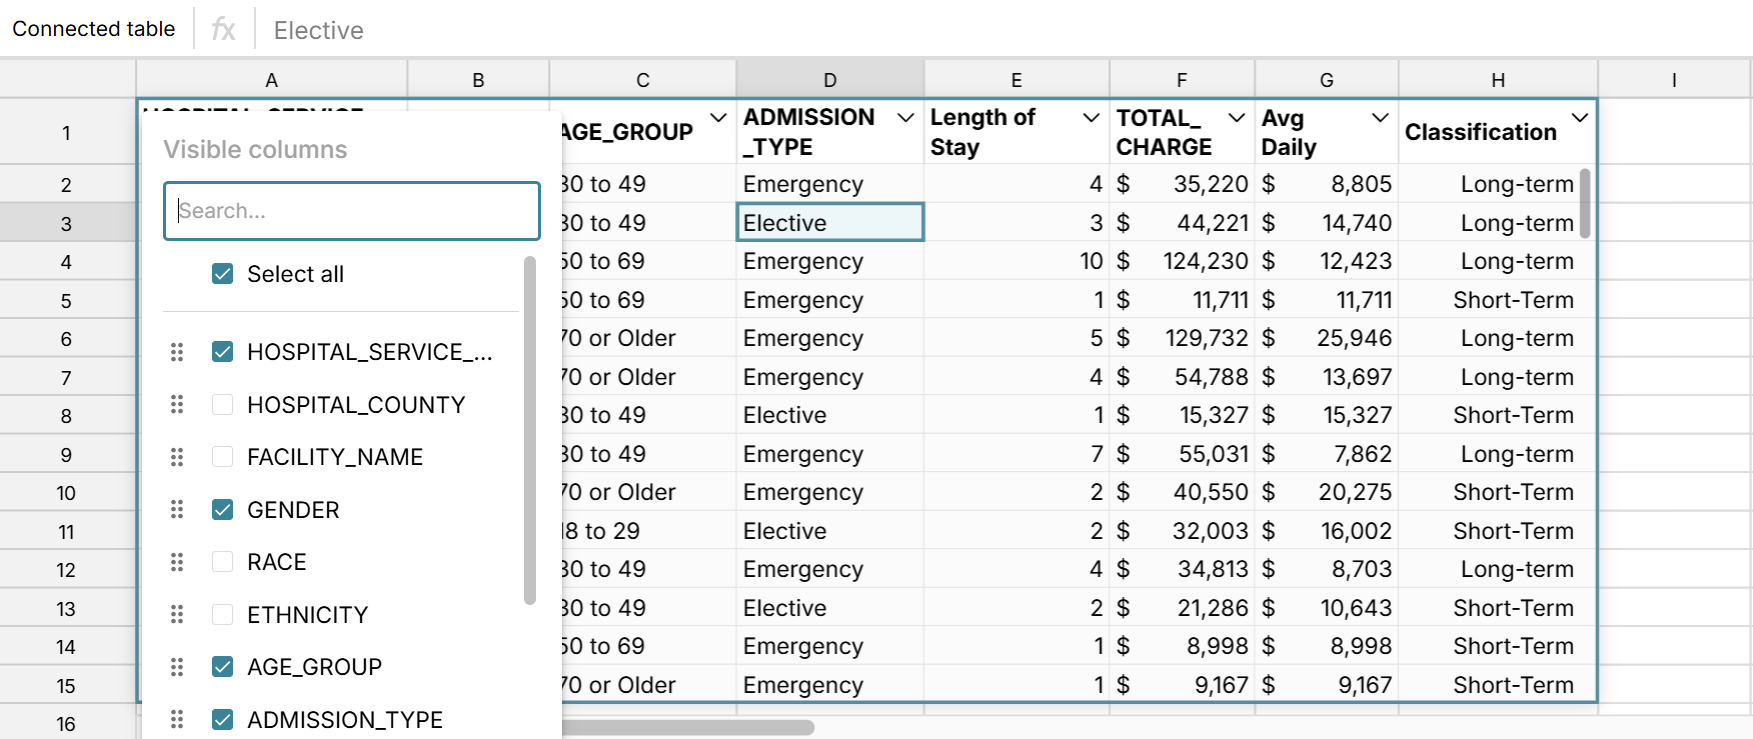
Data Table Interactions
Filter and Sort
Filter and sort data tables just like any other filtered range in a spreadsheet. You can filter and sort by clicking the toggle in the column header or by right-clicking in the data table and selecting Sort or Filter column. You can easily add multiple filters and sorts. Note that when you filter and sort your data table, those filters and sorts are also applied to pivot tables and charts referencing the data table.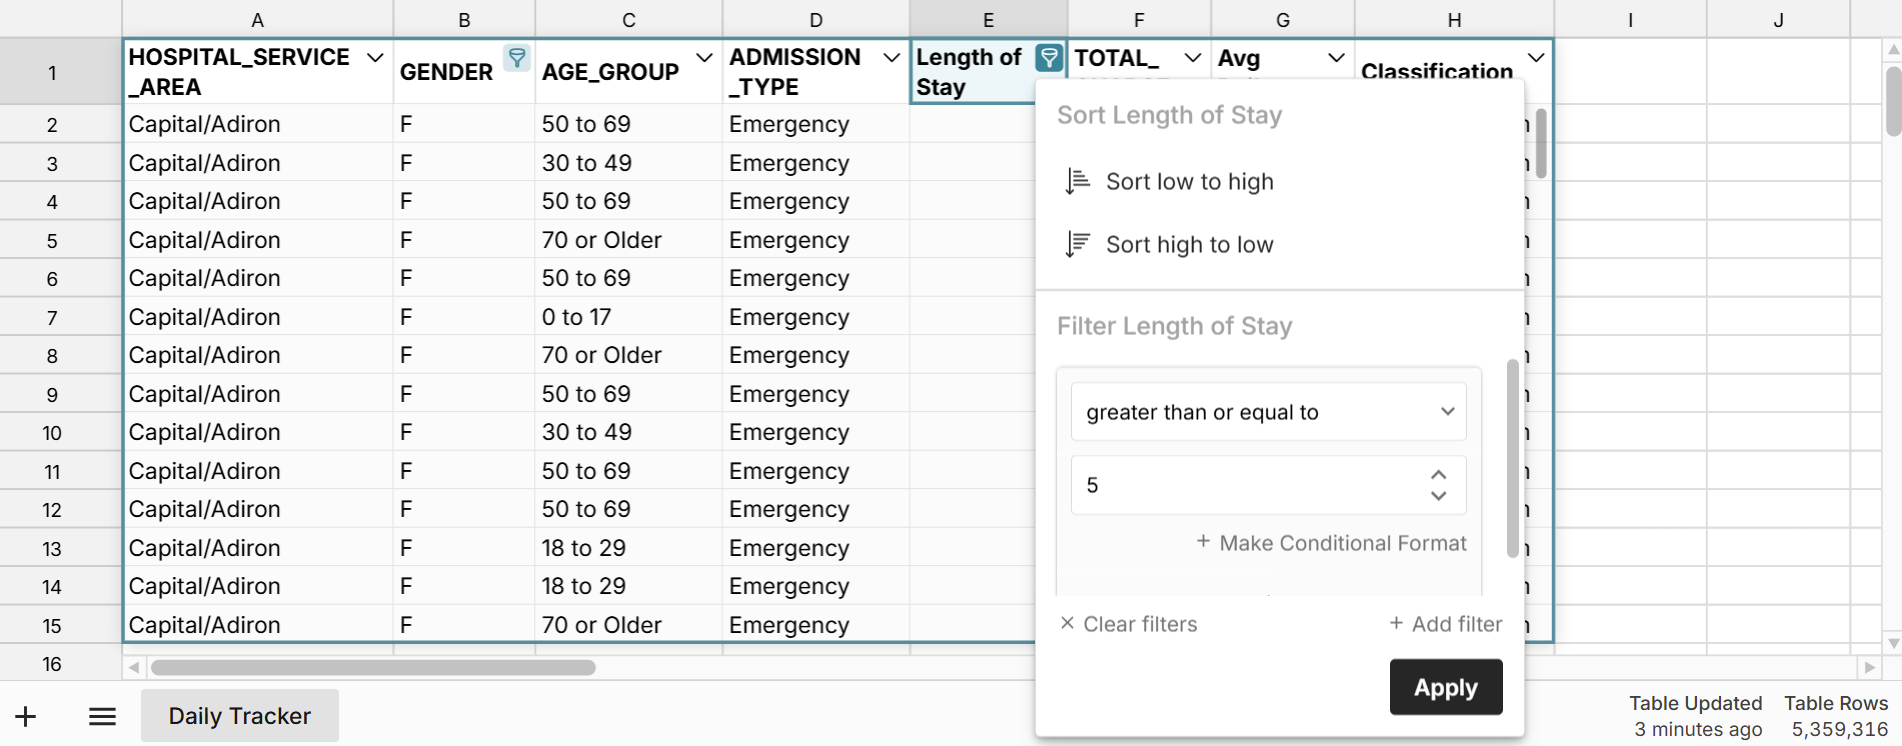
You can use the "~" operator in formulas that reference data tables to also have formulas filter in sync with data table filtering (see screenshot below). 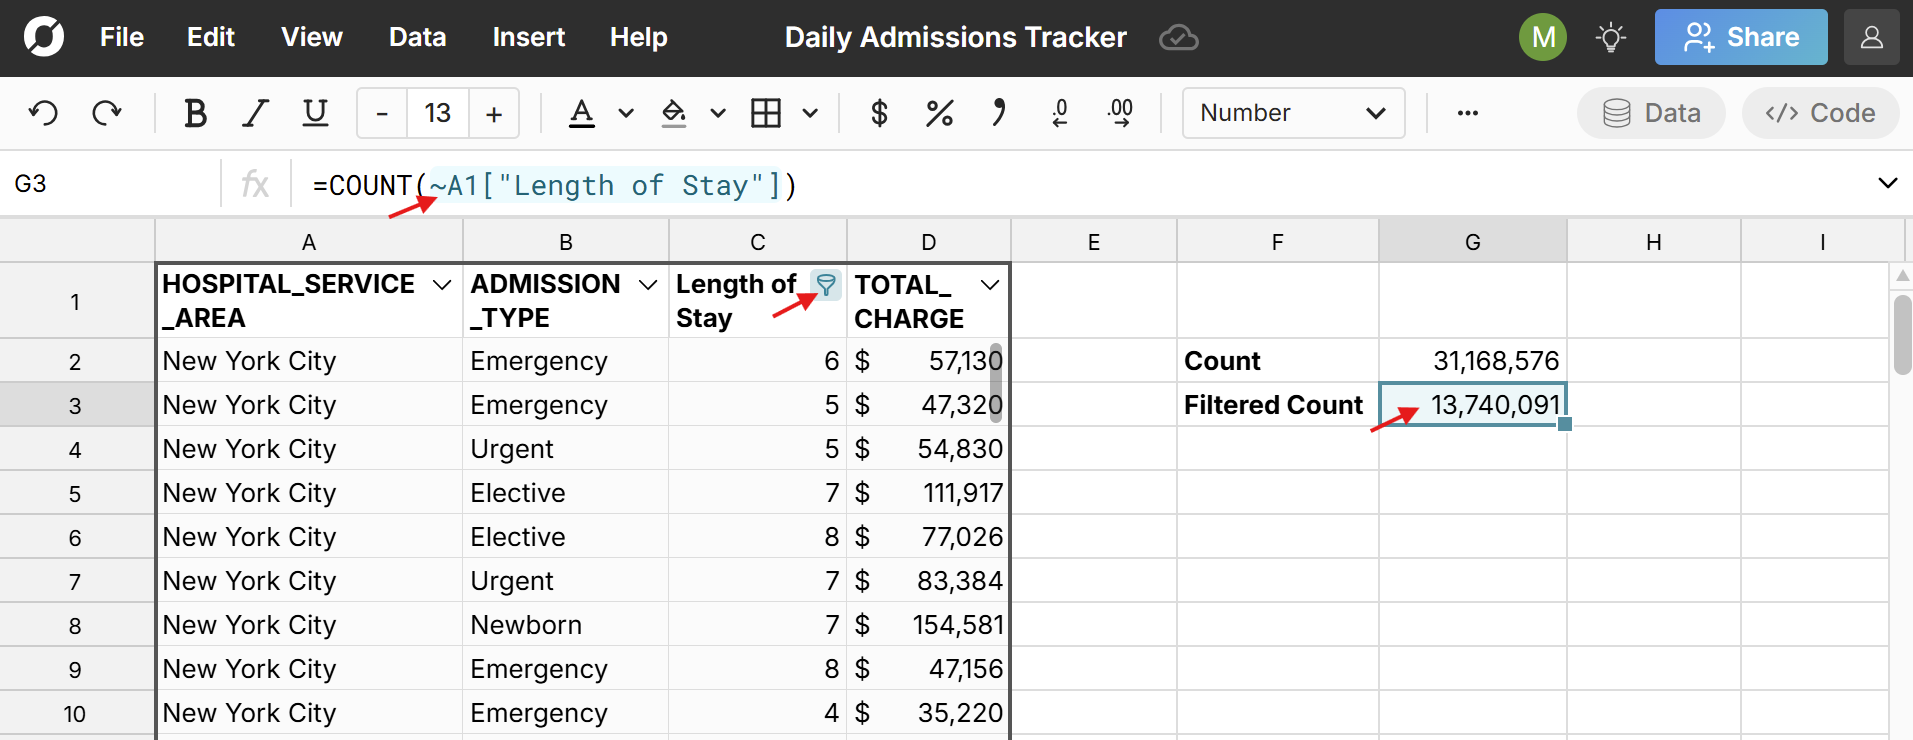
Edit Data
The data inside a data table cannot be edited. It can be manipulated on a column level by creating new columns or using filter and sort features. If you want to edit the data, you can right-click and "Explode table" to explode to cells where you can fully edit and delete data.
Format Data
Data in data table columns can be formatted by selecting the column of interest and using standard spreadsheet formatting buttons or keyboard shortcuts. Data tables also support conditional formatting. Note that formatting is applied to the entire column.
Build on top of data tables
You can easily build pivot tables, charts, formulas, etc. that reference columns in data tables as their source. These will dynamically update as your data table updates. For example, when your connected table updates with new data, everything referencing it updates as well. If you filter a data table, pivot tables and charts referencing it are also filtered.
Pivot data tables
Right-click on a data table and select Pivot to create a pivot table from your data table. Keep in mind that pivot tables are also data tables, so you can pivot a pivot table.
Charts and graphs
Select cells in the data table and go to Insert, Chart in the workbook header navigation to create a chart. Note that charts created from data tables use entire columns as source data. If you want to chart specific cell ranges, explode your data table to cells.
Formulas and calculations
Formula functions like SUM, COUNTIF, XLOOKUP, etc. can be run on individual columns within a data table. To execute a function, type your function in the desired cell and select the column of interest in the data table by clicking on it or arrowing over to select it. You will see the name of the column auto-fill in your function. When formulas are entered in the first column to the right of the data table, they are added to the data table as calculated columns. 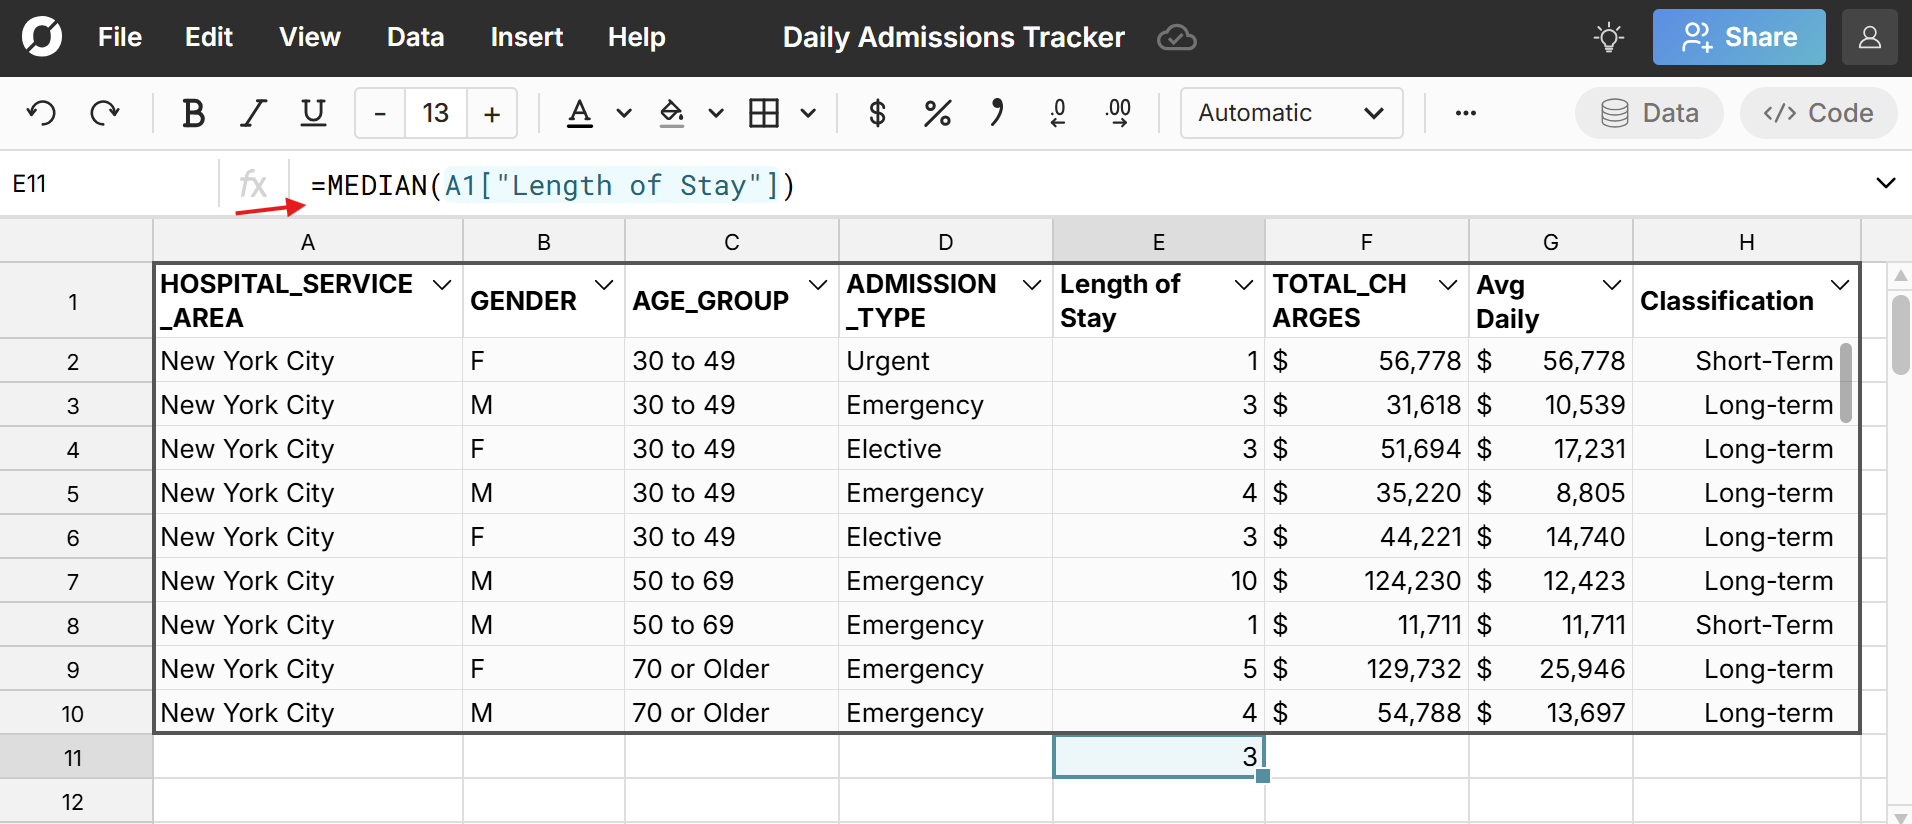
Shared data sources
The Data Sources feature lets teams share queries as dynamic data sources that can be refreshed or scheduled to update automatically. This is an easy way to give less technical users one-click access to live updating data. Data Sources import into the spreadsheet as a connected table. 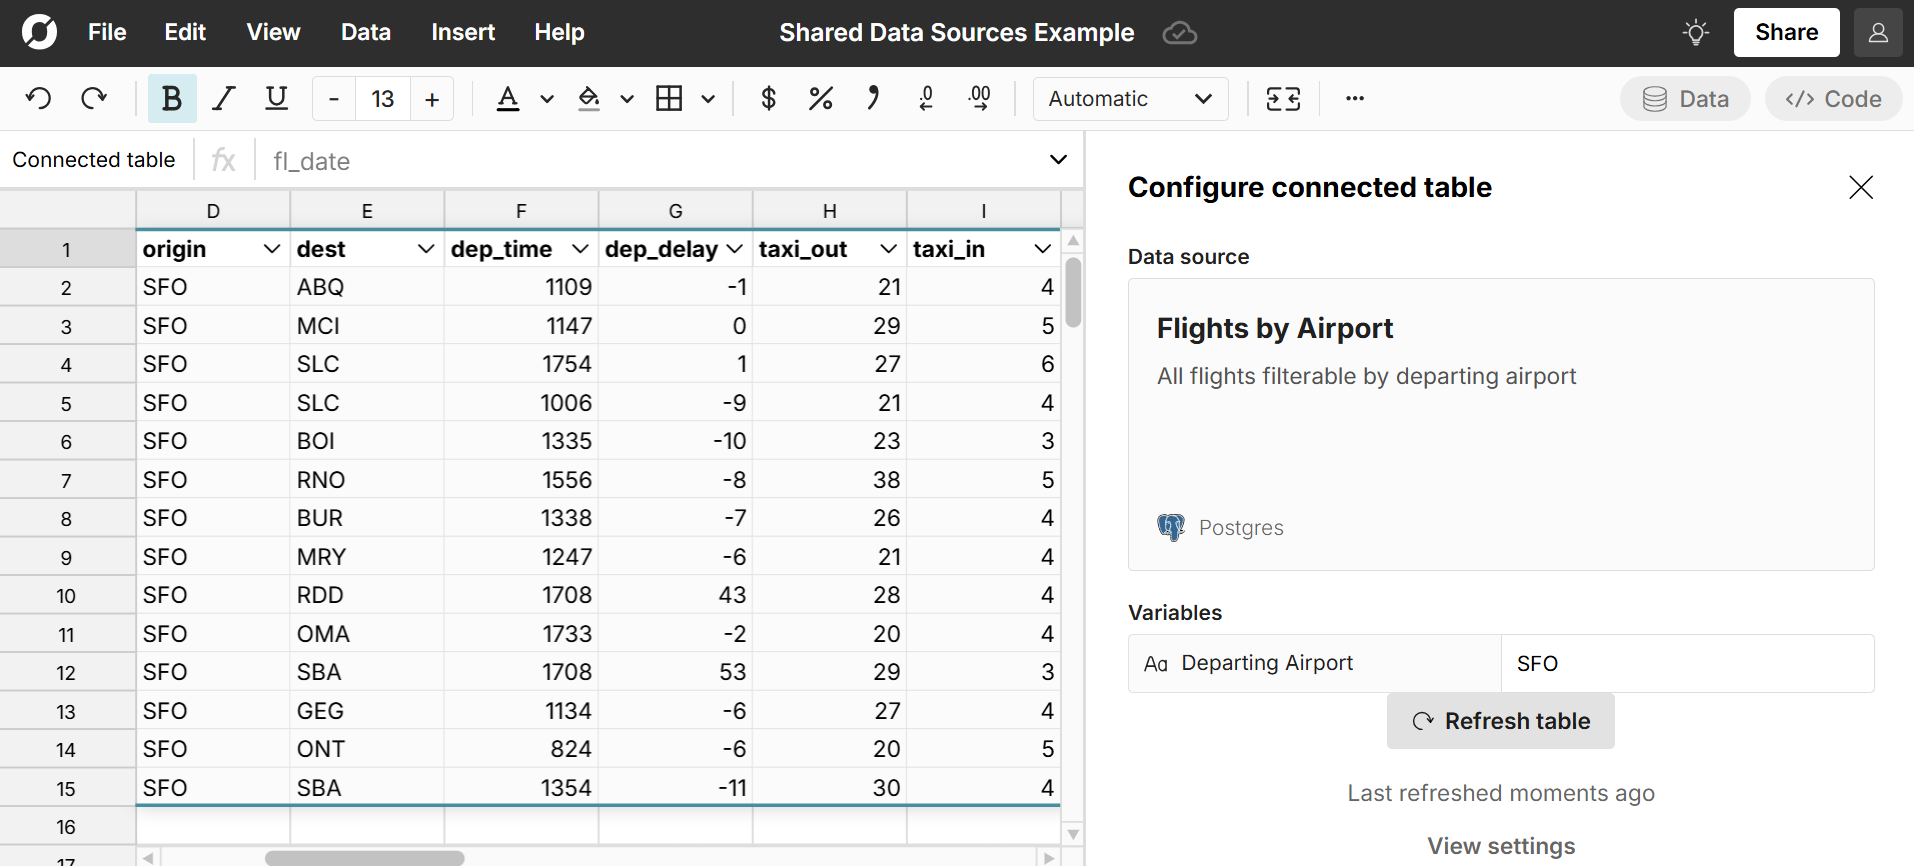
Imported tables and dynamic file import
When importing a file, the user can select the destination (new sheet or specific cell in an existing sheet) and whether to import as cells or as a data table. Data tables originate from the upper left most corner of the table. 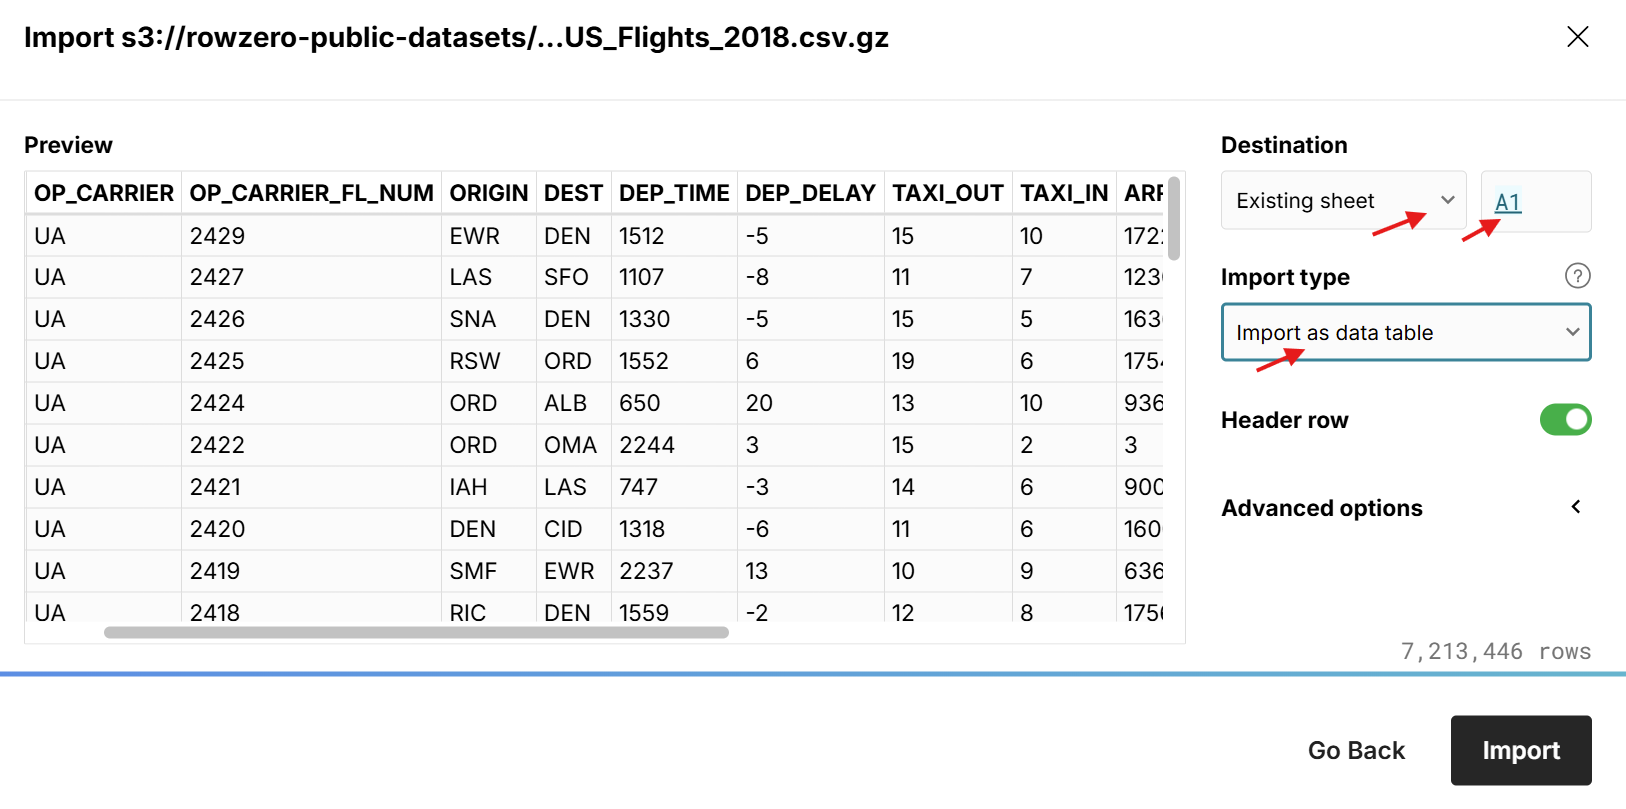 Importing to a specific cell lets you dynamically import updated files into an existing sheet so you can update your reports and workflows dynamically via file import as files are updated with new data. As long as your file contains the same columns and is imported into the same location, your imported file will dynamically update everything referencing your imported table. Here's a video tutorial of updating imported data tables:
Pivot tables
Pivot tables display as data tables in Row Zero so they have the same features as connected tables. Right-click inside a pivot table to open the context menu where you can edit and configure your pivot table, manage columns, pivot your pivot table, sort and filter, cut/copy, explode to cells, and export the pivot table to CSV or a data source. 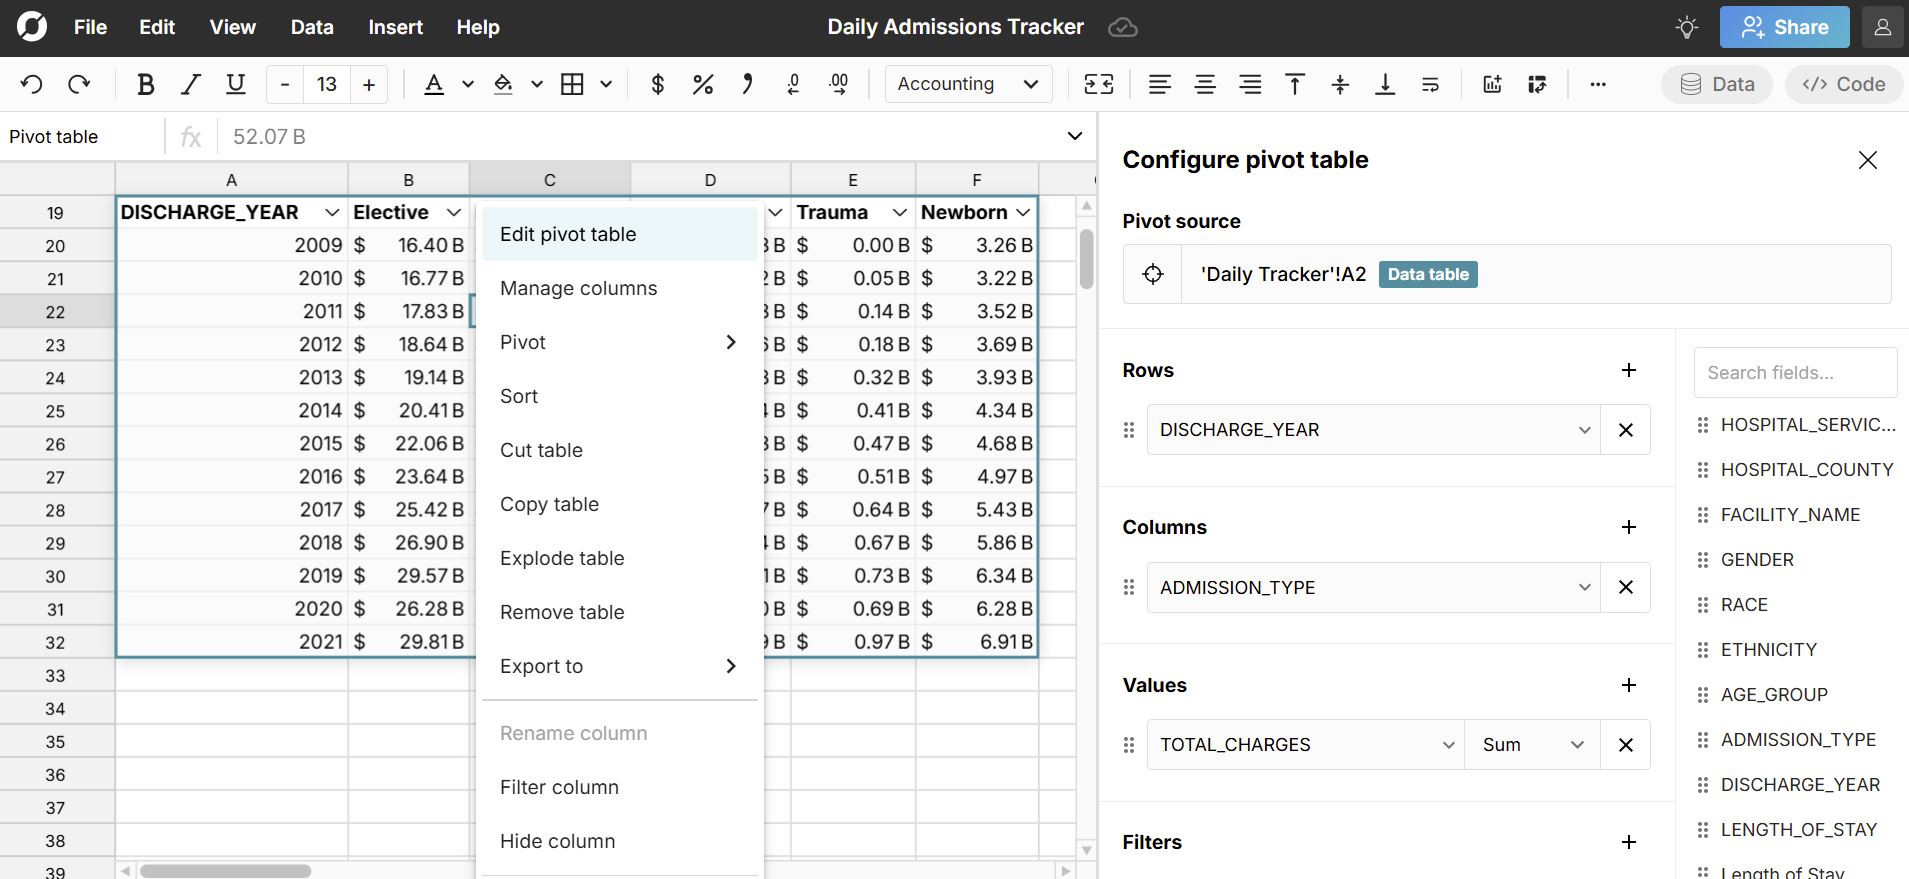 You can also format, chart, add calculated columns and reference pivot table columns in formulas.
Formula tables
Several formula functions return data tables when executed including COUNTUNIQUE, BUCKETCOUNT, FREQUENCY, etc. 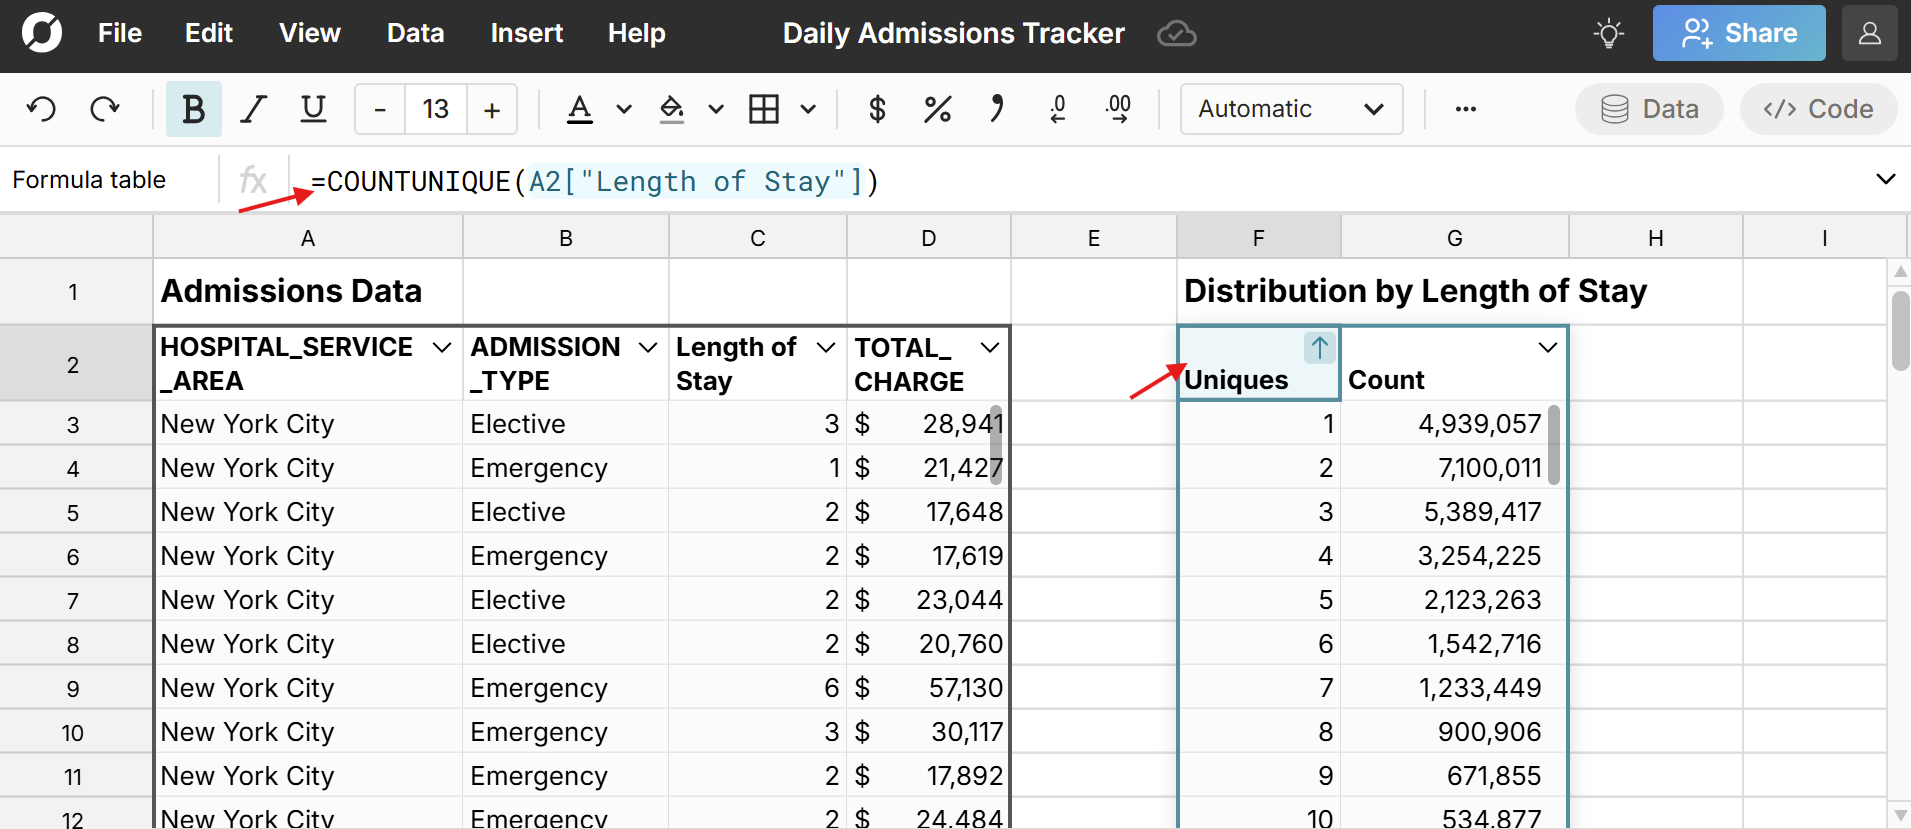 You can also convert spreadsheet cells to a data table use the DATATABLE() function. These formula tables work just like connected tables and imported tables.