Tableau is one of the most popular business intelligence (BI) tools on the market today. It is consistently in the "leader" category of Gartner's Magic Quadrant for business intelligence and analytics software - the go-to market research report for enterprise software. Along with Microsoft Power BI, Tableau takes up the majority of the BI and analytics market share and is at least in the conversation for most companies purchasing a new BI and analytics solution in 2024.
If you are determining if Tableau is the right BI and analytics tool for your organization, there are a number of factors that you should consider. Most of Tableau's advantages and limitations are highly dependent on your organization and your data analytics goals.
Below are some questions you should ask to determine if Tableau is the right tool for your organization’s needs. Read on or jump directly to specific sections. 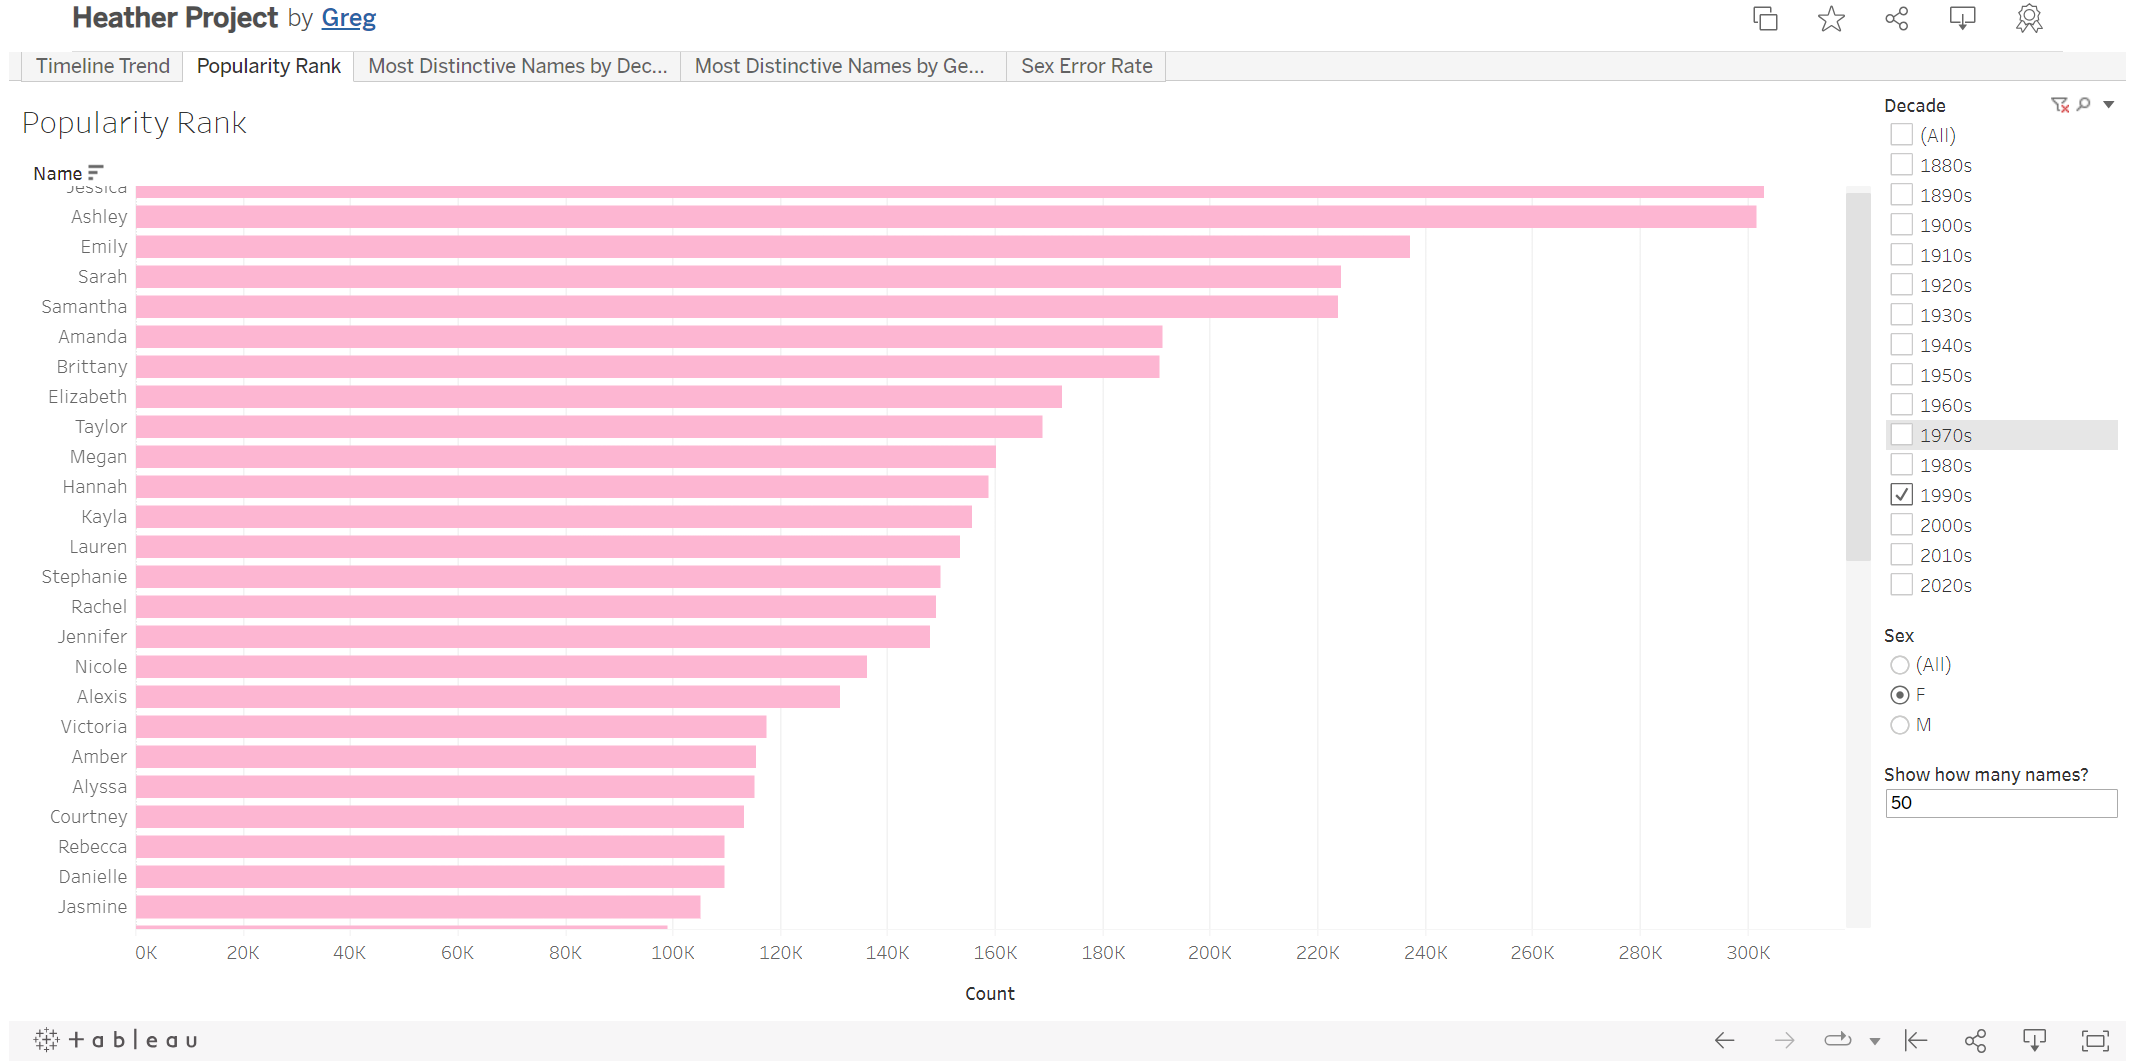
- Who are your data consumers and what do they need?
- What type of data analysis are you doing?
- Who is performing data analysis in your organization?
- How much does Tableau cost?
- What are the Tableau alternatives?
- Conclusion
Who are your data consumers and what do they need?
Tableau is first and foremost a data visualization tool. If your goal is to create and share interactive dashboards that are visually appealing in an easy-to-use application, it's going to be tough to find a better option than Tableau. Tableau really shines when it comes to the look and feel of visualizations and dashboards.
Tableau is a solid option when your data consumers can gain the insight they need from data by analyzing a chart, graph, or other type of data visualization. If your data consumers plan to perform their own analysis or dig deeper into data, they may end up disappointed with Tableau. A common refrain from more analytical data consumer roles like financial analysts or supply chain planners after seeing a Tableau dashboard is "Great - now can you give me the underlying data?"
What type of data analysis are you doing?
Again, Tableau is first and foremost a data visualization tool. If you are doing more advanced analytics, like building machine learning models, complex data analysis, or predictive modeling, you'll likely need a more analysis-focused tool. You can create visualizations of the results of more advanced analytics using Tableau, but core analysis isn't Tableau's strong suit.
Additionally, if you have to do extensive cleaning and transformation of data in your BI and analytics tool, Tableau may not be a great fit. Tableau Prep, Tableau’s data preparation tool, allows you to do data cleaning and transformations, but it lacks some of the features of an enterprise extract, transform, load (ETL) application.
Performance-wise, Tableau can handle relatively large data sets and analysis, but isn’t built for things like aggregations over a large number of values like many columnar cloud data tools are, particularly from real-time data connections.
Additionally, as mentioned before, if your data consumers expect to perform their own analysis on data, they won't be able to do so with a Tableau Viewer license and even with a Creator license, they will be forced to work in a tool that isn’t natively built around complex data analysis.
Who is performing data analysis in your organization?
It's important to match your BI and analytics application to the skill set of your data analysts or those who will be performing data analysis in your organization.
Tableau has a drag-and-drop, "no code" UI tailored toward business-focused, less technical users. It's relatively simple to connect to an external, real-time data source and quickly start creating meaningful data visualizations. However, as with any no code solution, there’s a tradeoff between ease-of-use and capability.
When Tableau users start to hit limitations of what's easily accomplished in the drag-and-drop UI, they will likely need to resort to clunky workarounds or extension packages to produce the result they’re looking for.
How much does Tableau cost?
Tableau costs are highly dependent on who needs to access data and dashboards. While the list prices may look small at first glance, for a lot of organizations, Tableau total costs start to balloon quickly. Additionally, a lot of organizations have seen price increases and stricter license policies since Tableau was acquired by Salesforce in 2019.
Creator licenses are $75/user/month, Explorer licenses are $42/user/month and Viewer licenses are $15/user/month at the time of this writing. If you have a dashboard that you want to share widely within your organization, the cost of providing Viewer licenses to everyone who needs access to a dashboard can add up quickly.
If you are running Tableau on-prem, you also need to plan for the engineering resources to administer Tableau Server and the underlying hardware (and purchase/provision the hardware itself), as well as monitor performance, and make updates.
Overall, Tableau is certainly one of the most popular BI and analytics applications on the market today in large part due to its strength with data visualization capabilities and general ease of use. However, it isn’t the right tool for every organization and every type of data analyst or data consumer.
What are the Tableau alternatives?
Power BI
Microsoft Power BI is a business intelligence (BI) application that has gained a lot of market share in the BI space over the past few years. Power BI Pro, the more barebones offering is $10/user/month and Power BI Premium is $20/user/month. However, these licenses come with throttled performance, size, and refresh rates and larger organizations and organizations with more complex data needs will likely get into paying for Power BI Premium per capacity quickly. Power BI is generally difficult for untrained professionals to use but is well liked by those who know how to use it. It is best suited for companies already on the Microsoft toolset and there is no offering for Macs.
Looker
Google's business intelligence offering is Looker, an enterprise grade dashboarding and BI applications. Looker pricing reportedly starts at $30k annually but Google does not publish pricing and when you have to ask for the price, you know it's expensive. Looker comes complete with dashboard features and shareable reports. It is in the realm of usability as Tableau and Power BI, if you're trained or a data analyst with experience, it's great but average business users will need training to get use out of it.
Row Zero
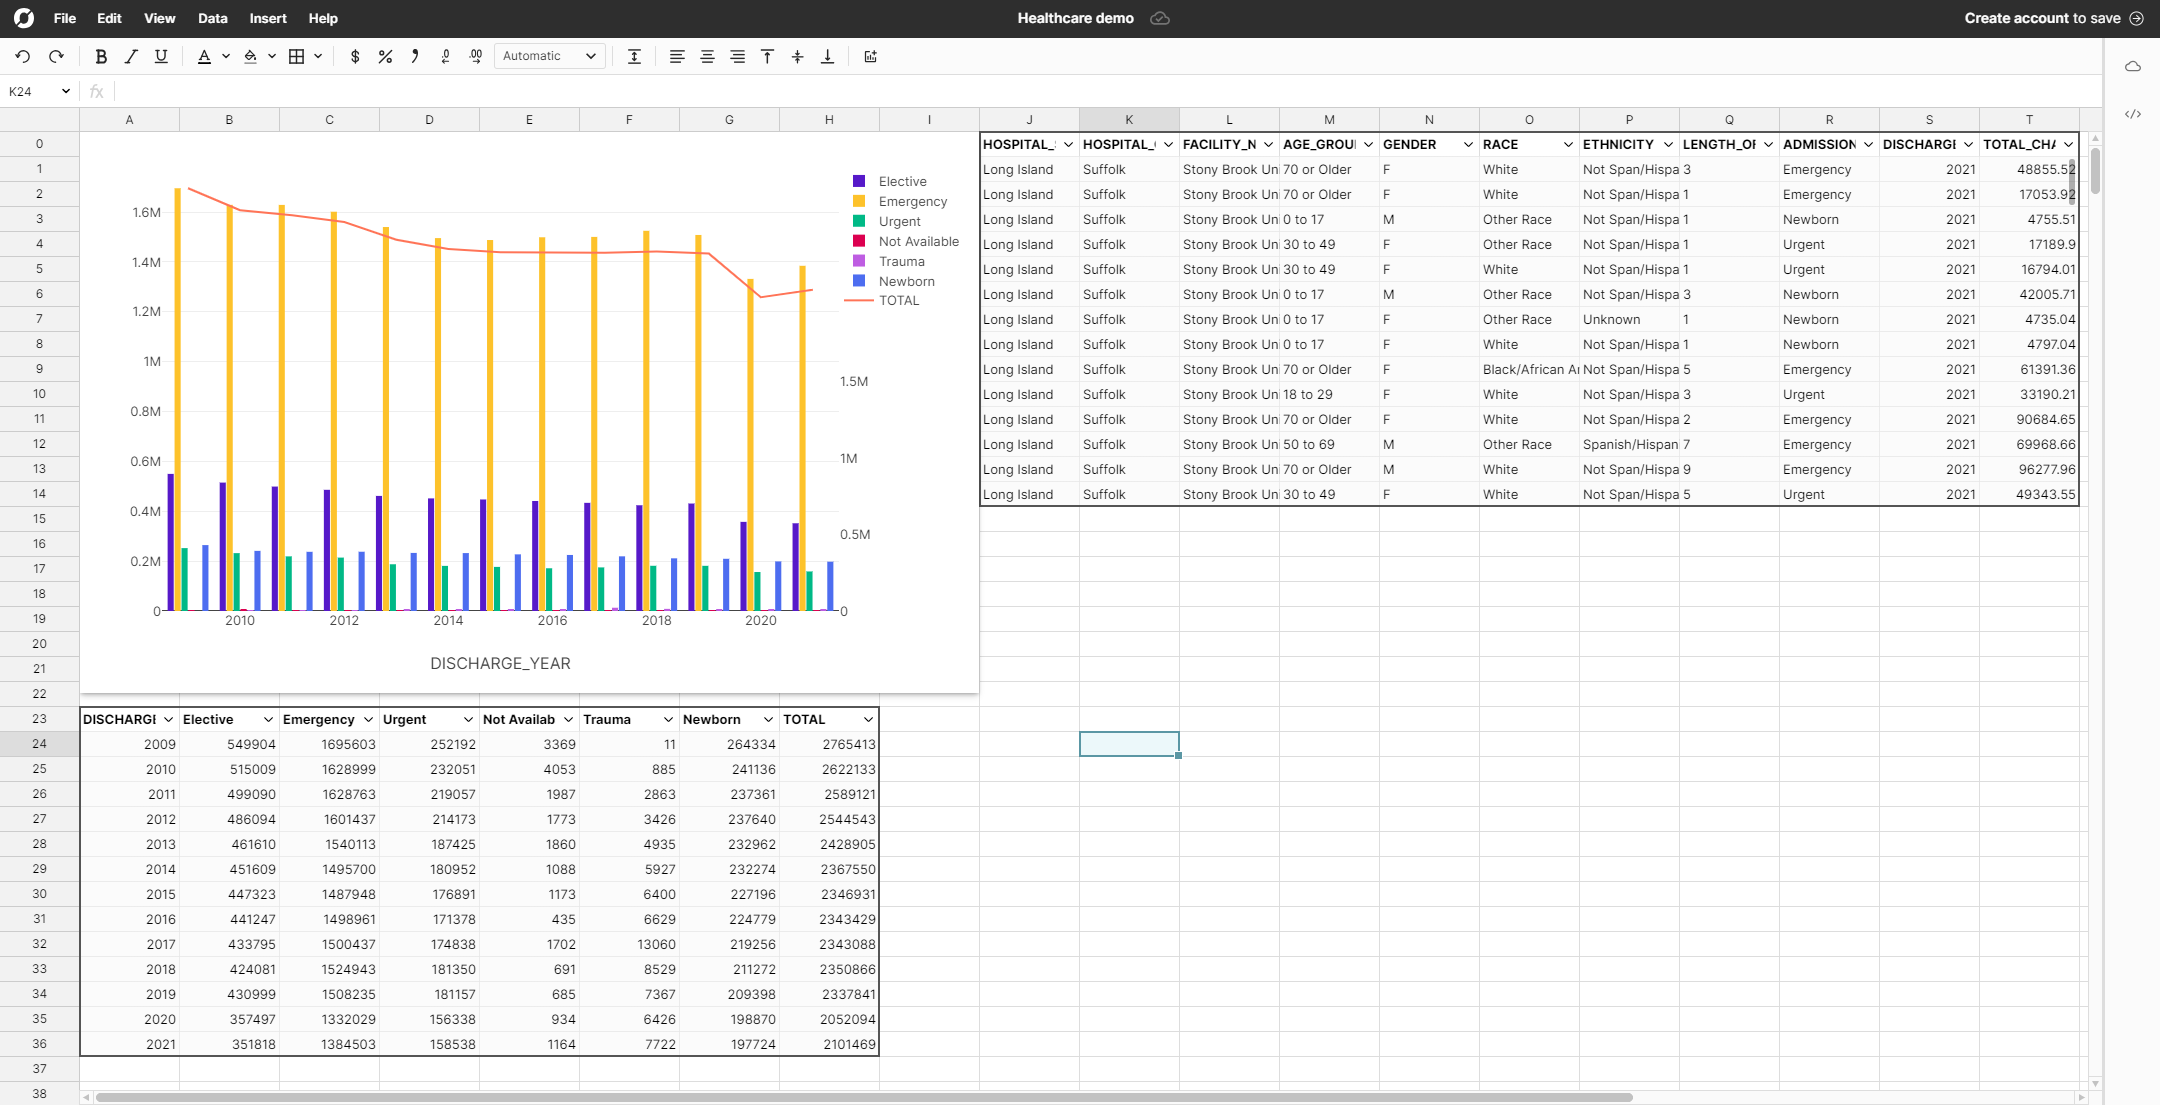
In contrast to Tableau, Row Zero is the analysis tool your business teams are asking for. Row Zero is a simple and powerful tool every consumer of data can use to analyze big data sets and create dashboards. Without access to underlying data and the ability to manipulate, pivot, and graph it, Tableau dashboards are static assets that don’t answer the questions that help businesses progress.
The spreadsheet is the pinnacle of a flexible analytics tool, which is why they are so hard to build. Row Zero enables users to analyze data in the spreadsheet format they all know. Pivot tables and graphs are standard but a spreadsheet can support longitudinal forecasts, sensitivity analyses, conditional formatting, and all the cell level computations users can construct.
Sharing an analysis should be easy. With Row Zero, sharing read-only analyses is free and paying accounts all have the same abilities to create, modify, and duplicate every type of analysis.
Conclusion
After reviewing what to think about before committing to Tableau, it's easy to see that Tableau is a great application for visualization heavy use case. As an organization wide analytics tool, Tableau will struggle to gain high usage rates from employees outside data and analytics teams. Pricing can be costly, especially for users that do not engage.
At Row Zero, we believe data analysis shouldn’t be hard or expensive. The size and performance limitations of spreadsheets led to the creation of Tableau and other rigid BI tools, like Looker and PowerBI. Row Zero is a new generation of spreadsheet that brings speed and flexibility to the world of big data analytics.