Microsoft Power BI is a business intelligence (BI) application that has gained a lot of market share in the BI space over the past few years. Various sources report different market share numbers for Power BI and Tableau, the other consistent leader in the BI space. However, it’s pretty widely accepted that Power BI’s market share is growing at a much quicker rate than Tableau’s. If you are choosing a new BI application in 2024, you’re probably going to evaluate Power BI.
Power BI’s focus is on interactive data visualizations and reports, but in recent years, Microsoft has expanded the Power BI ecosystem to include services and applications deeper in the BI software stack, like data source connectivity and integration services, data preparation applications, and tighter integration with data services from Azure, Microsoft’s cloud computing platform.
Like most software, Power BI’s advantages and limitations are dependent on a lot of factors about your organization and your BI and data goals.
Below are some questions you should ask to determine if Tableau is the right tool for your organization’s needs. Read on or jump directly to specific questions.
- Does your organization use other Microsoft products?
- Who are your data consumers and what do they need?
- What type of data analysis are you doing?
- Who is performing data analysis in your organization?
- How much does Power BI cost?
- What are the Power BI alternatives?
- Conclusion
Does your organization use other Microsoft products?
Because Power BI is so tightly integrated with other Microsoft products, like Windows, Office, SQL Server, and Azure, it can feel like a natural choice for organizations already heavily invested in the Microsoft ecosystem. Not only are there integration and licensing advantages, but the look and feel of Power BI will likely seem very familiar to users already using Microsoft products.
However, if your organization is not already using a lot of Microsoft products, Power BI can be tough to force into your tech stack. In order to fully take advantage of a lot of the capabilities, you may find yourself needing licenses or subscriptions to some of the adjacent Microsoft offerings. Even at a more basic usage level there are some practical considerations for those not running Microsoft products, like the fact that there is no native Mac application for Power BI Desktop.
Who are your data consumers and what do they need?
Power BI puts a large emphasis on dashboards and data visualization. If the organizational model you have consists of a person or team responsible for conducting data analysis and business intelligence development and then sharing a dashboard or report summarizing that analysis with data consumers, Power BI supports that model well. Sharing a dashboard or set of reports with a large number of users is possible if the viewing users have the appropriate Power BI licenses or if you have an enterprise Power BI embedded license. Power BI embedded licensing also allows you to embed reports or dashboards in a web application or website accessible to people external to your organization. This is a capability that some other BI tools don’t allow.
Despite the emphasis on dashboards and data visualization, if your data consumers are expecting really polished, heavily designed visuals, Power BI is somewhat lacking in visualization and customization options. Customization options do exist for Power BI visualizations, but they are much more designer-centric than most BI tools and outside the skill set of your typical data analyst or user (custom CSS for example).
If your data consumers are more analytical users who are expecting to do their own analysis and really slice and dice data in a self-serve manner, Power BI may not be the right fit as the emphasis is really on creating shareable analysis artifacts like dashboards and reports. While Power BI does give users the ability to export data to Excel to do their own analysis, the data then becomes subject to Excel’s data limitations.
What type of data analysis are you doing?
It's important to match your BI and analytics application to the skill set of your data analysts or those who will be performing data analysis in your organization. Data analysts doing more complex data analysis in Power BI or bringing in and combining multiple data sources will likely need to learn the DAX programming language. This means there’s a fairly steep learning curve to doing more complex data analysis in Power BI.
Additionally, Power BI is not designed to handle advanced analytics. Machine learning or other types of compute-heavy analysis and model building will likely prove to be a performance drag in Power BI. That being said, Microsoft is taking steps to combine their “power” line of products, including Power BI, with some of the more advanced data services in Azure, their cloud computing platform, like Azure Data Factory and Synapse through their Microsoft Fabric product to provide deeper analytic capabilities in the future.
All that is to say, there are better options for a BI and analytics tool if you are doing more advanced analytics or if you have data consumers expecting to conduct their own analysis without learning an entirely new application.
Who is performing data analysis in your organization?
Power BI borrows a lot of features, user experience, and terminology from the Microsoft Office suite of products, so heavy Excel users and those in organizations who run the Office suite will likely feel more at home in Power BI than in other BI tools.
Because of Power BI’s emphasis on data visualization and reporting, more analytic users may want a tool that offers more self-serve data analysis capabilities.
How much does Power BI cost?
Microsoft’s licensing and pricing structure for Power BI is rather complex and ever-changing. At the time of this writing Power BI Pro, the more barebones offering is $10/user/month and Power BI Premium is $20/user/month. However, these licenses come with throttled performance, size, and refresh rates and larger organizations and organizations with more complex data needs will likely get into paying for Power BI Premium per capacity quickly.
The Power BI embedded options and new offerings from Microsoft that bundle Power BI with Microsoft Fabric, which includes access to a lot of the Microsoft Azure data services, further complicate the licensing and pricing models.
What are the Power BI alternatives?
Tableau
Tableau is known for its data visualization capabilities. Once a data source is connected to Tableau, users can make all sorts of fancy visualizations. Charts, graphs, and geographic visualizations are just a few of the options. Pricing for Tableau is per user. Creator licenses are $75/user/month, Explorer licenses are $42/user/month and Viewer licenses are $15/user/month. Enterprise contracts may differ. Generally Tableau does not get a ton of usage from business partners because users generally need some sort of training to learn the program. Dashboards are often consumed by large bases of employees within an organization.
Looker
Google's business intelligence offering is Looker, an enterprise grade dashboarding and BI applications. Looker pricing reportedly starts at $30k annually but Google does not publish pricing and when you have to ask for the price, you know it's expensive. Looker comes complete with dashboard features and shareable reports. It is in the realm of usability as Tableau and Power BI, if you're trained or a data analyst with experience, it's great but average business users will need training to get use out of it.
Row Zero
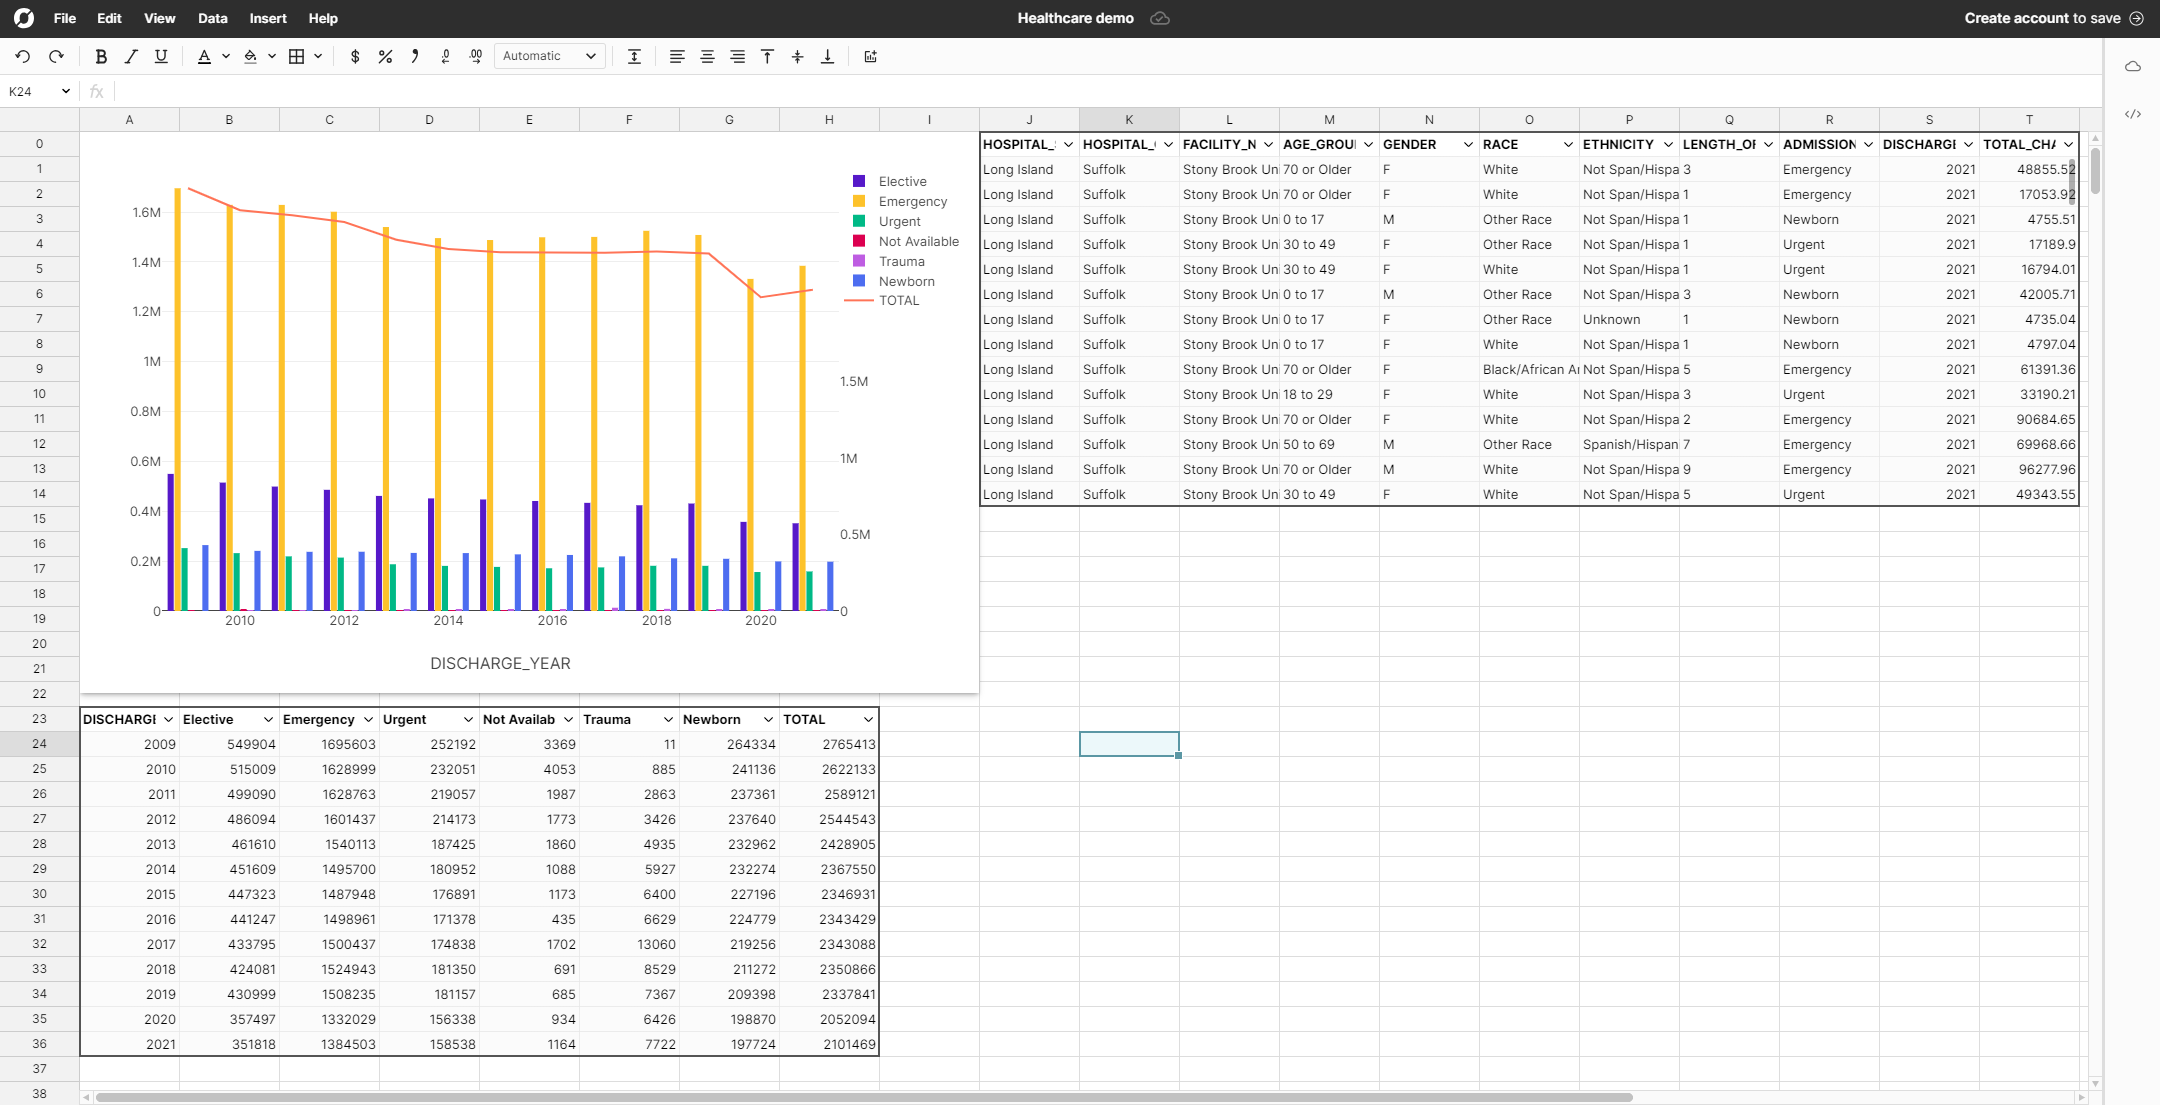
Row Zero is the analysis tool your business teams are asking for. Row Zero is a simple and powerful tool every consumer of data can use to analyze big data sets and create dashboards. Without proper training Power BI is hard for the average business analyst to use. Row Zero is designed for big data so it won't crash or freeze, like Excel and Google Sheets.
The spreadsheet is the pinnacle of a flexible analytics tool, which is why they are so hard to build. Row Zero enables users to analyze data in the spreadsheet format they all know. Pivot tables and graphs are standard but a spreadsheet can support longitudinal forecasts, sensitivity analyses, conditional formatting, and all the cell level computations users can construct.
Sharing an analysis should be easy. With Row Zero, sharing analyses is free and they can be shared even with users that don't have accounts.
Conclusion
After reviewing the content above, it's apparent Power BI is best for organizations that are already using Microsoft products, like MS Office and Azure. It is also best for companies that have data analysts trained in the use of advanced analytics tools, like Power BI. While Power BI is on the cheaper end of BI tool pricing, bigger organizations will pay compute and hosting fees.
At Row Zero, we believe data analysis shouldn’t be hard or expensive. The size and performance limitations of spreadsheets led to the creation of Power BI and other rigid BI tools, like Looker and Tableau. While those tools served a purpose, there are now faster, more flexible, and easier to use tools on the market. Row Zero is an affordable new generation of spreadsheet that brings speed and flexibility to the world of big data analytics and business intelligence.