This post covers the pros, cons and step-by-step instructions for how to connect Excel to Amazon Redshift. We'll show how to use the Redshift ODBC driver to connect Redshift to Excel and import data.
We'll also show an easier and better alternative using Row Zero, an enterprise-grade spreadsheet with a built-in Redshift connector that supports billion row datasets (1000x Excel's limits). Read on for more information or skip to specific sections below.
Table of Contents
- How to connect Excel to Redshift
- 4 ways to import Redshift data to Excel
- Power Query (9 steps + ODBC driver installation)
- Power Pivot (12 steps + ODBC driver installation)
- Microsoft Query (8 steps + ODBC driver installation)
- Download and Open a CSV (9 steps)
- Better Option: Redshift to Row Zero (3 steps)
- Pros and cons of connecting Excel to Redshift
How to connect Redshift to Excel
The following instructions cover several methods for connecting Redshift to Excel using the Redshift ODBC driver. You must first download and install the Redshift ODBC driver and then take additional steps to import Redshift data to Excel as shown below.
Download and install the Redshift ODBC driver
- To start, download the AWS Redshift ODBC driver.
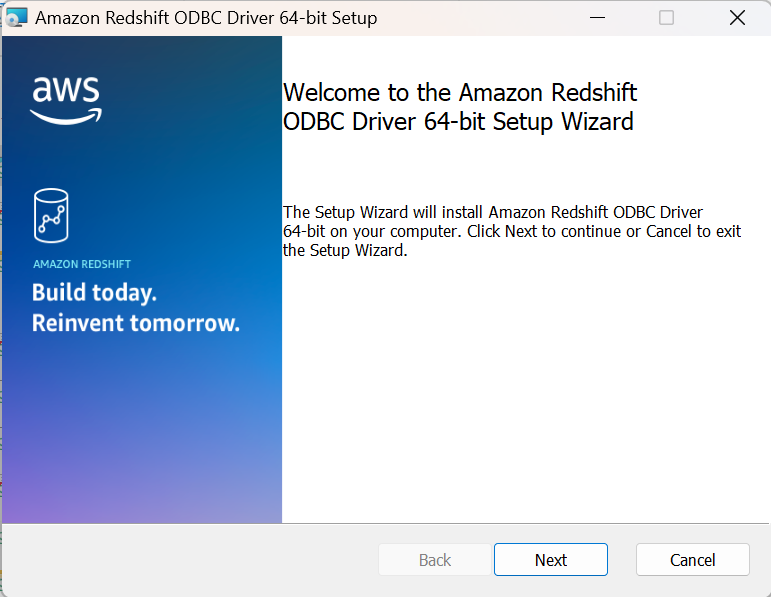
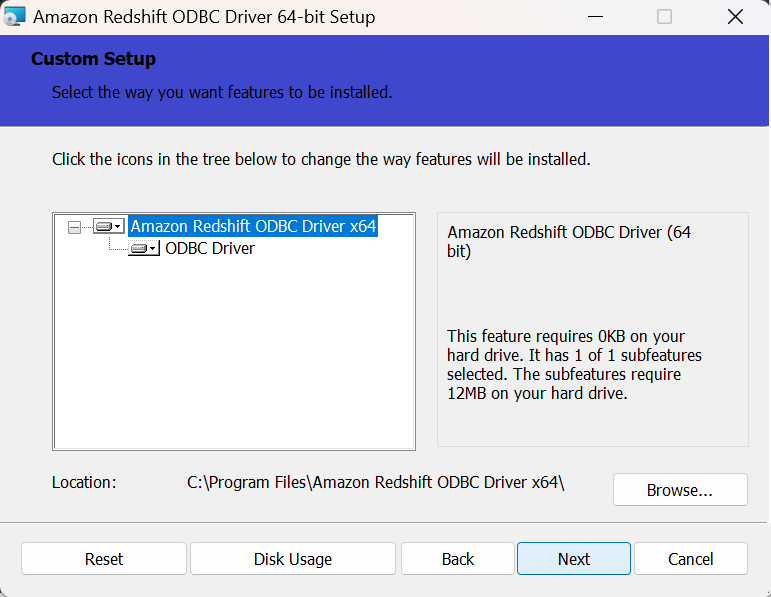
- Find the file on your computer and open it (double-click). Follow the installation instructions to install the Redshift ODBC driver.
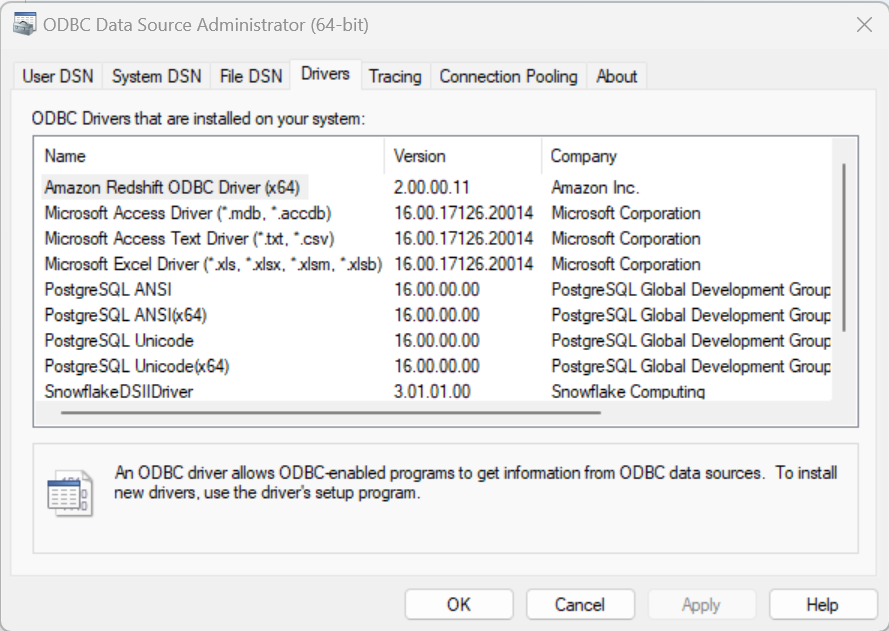
- Once the driver is installed go to the start menu and search for ODBC Data Sources.
- In the ODBC driver menu select the 'driver' tab and ensure you see Amazon Redshift ODBC Driver (x64) in the list.
- Next, select the System DSN tab, choose Add.
- Select Amazon Redshift ODBC Driver (x64) and then select Finish. The Amazon Redshift ODBC Driver DSN Setup will open.

- Enter your Redshift database credentials and connection strings. AWS provides details on connection settings. Once all strings are entered, click Test and if the test is successful, select Ok in both the credentials window and ODBC driver window. Your ODBC driver is now set up. If the test is not successful, make sure all entered credentials are correct or check with your database administrator.
4 Ways to Import Redshift Data to an Excel Spreadsheet
Each method will be briefly summarized, providing an overview of the options available. Before starting the first 3 methods, you will need to download and install the Redshift ODBC driver using the instructions above.
Power Query
Connecting Amazon Redshift to Excel using Power Query is a straightforward process. Power Query allows you to import and transform data from various sources, including Redshift. Here's a step-by-step guide:
- Open Excel: Launch Microsoft Excel on your computer.
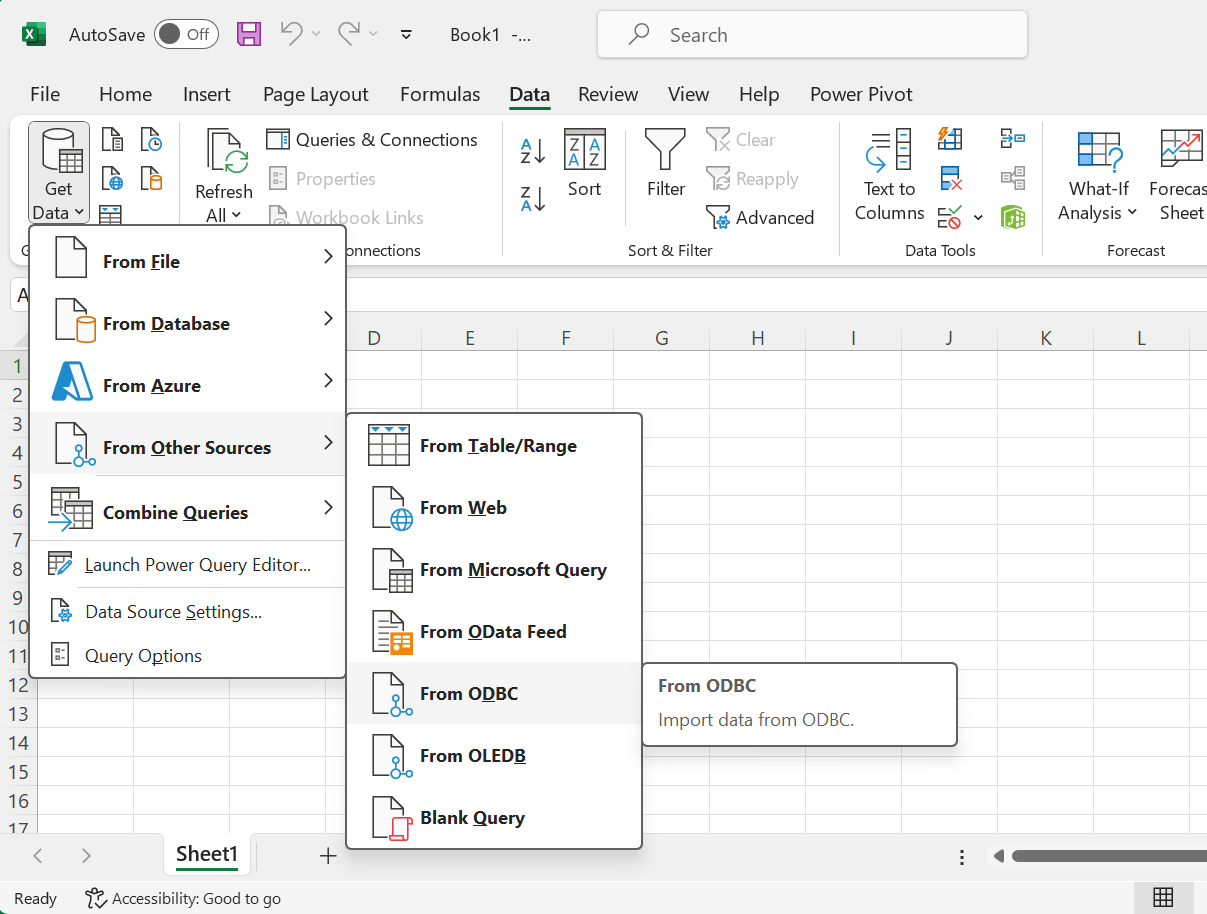
- Data Tab: Navigate to the "Data" tab on the Excel ribbon.
- Get Data: Click on "Get Data" or "Get & Transform Data" (depending on your Excel version).
- From Other Sources: Choose "From Other Sources" and then select "ODBC."
- Select the ODBC driver you installed earlier and click ok. You can also write a query in the query editor in the advanced section to further specify the data you want to import.
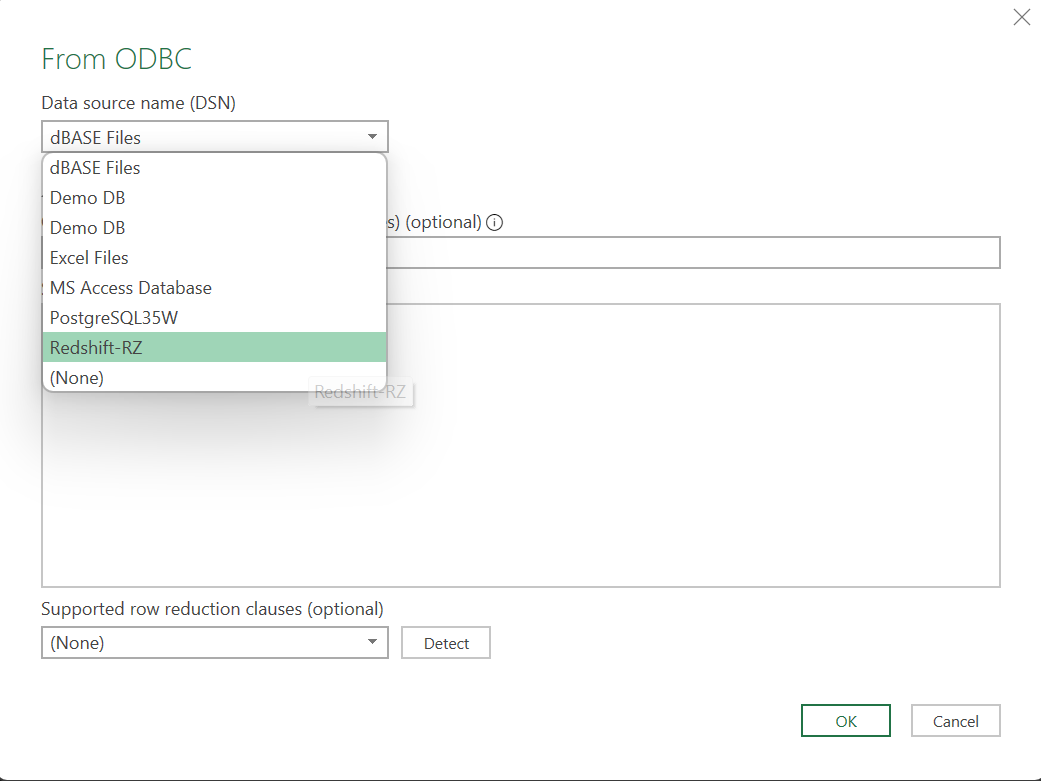
- Enter Connection Details: Enter the connection details for your Redshift database, including Server, Database, Username, and Password. These credentials will be saved so you don't have to enter them a second time. Click "OK" to establish the connection.
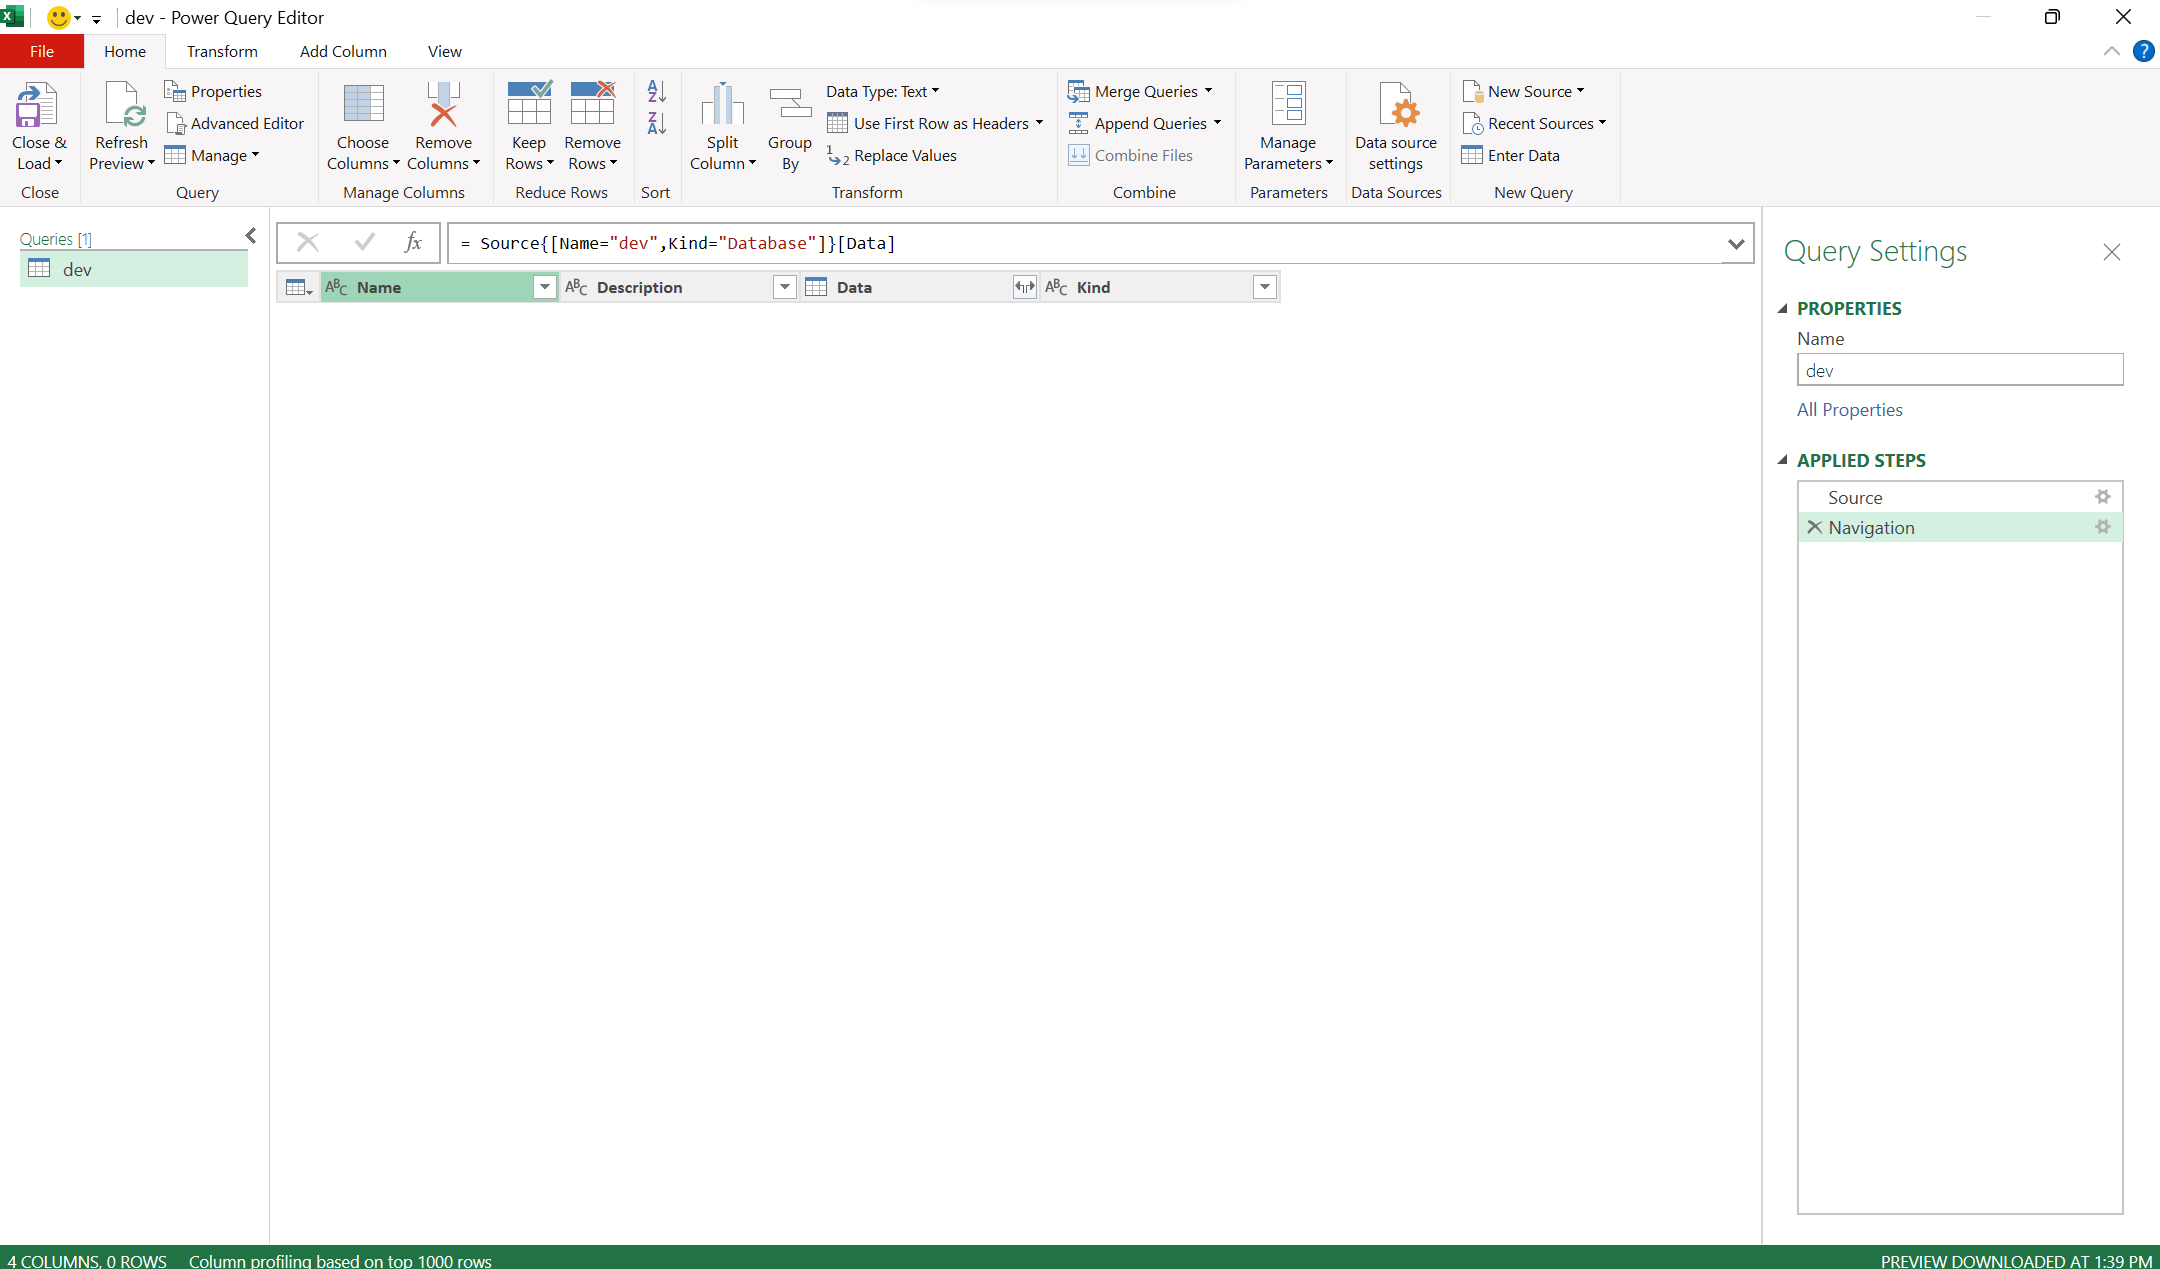
- Navigator: After establishing the connection, you'll see the Navigator window. Select the tables or views you want to import into Excel and click "Load" or "Transform Data."
- Query Editor: The data will be loaded into the Power Query Editor, where you can perform transformations if needed. You can filter, reshape, or combine data before loading it into Excel.
- Load Data into Excel: Once you're satisfied with the data transformations, click "Close & Load" to load the data into an Excel worksheet. Note If your data set is large, it will take a long time to load into Desktop Excel or Excel 365. The issue is Redshift is a hosted data source so the data must travel from the internet to your computer and then be loaded by Excel, which is limited to the memory and compute resources of your laptop.
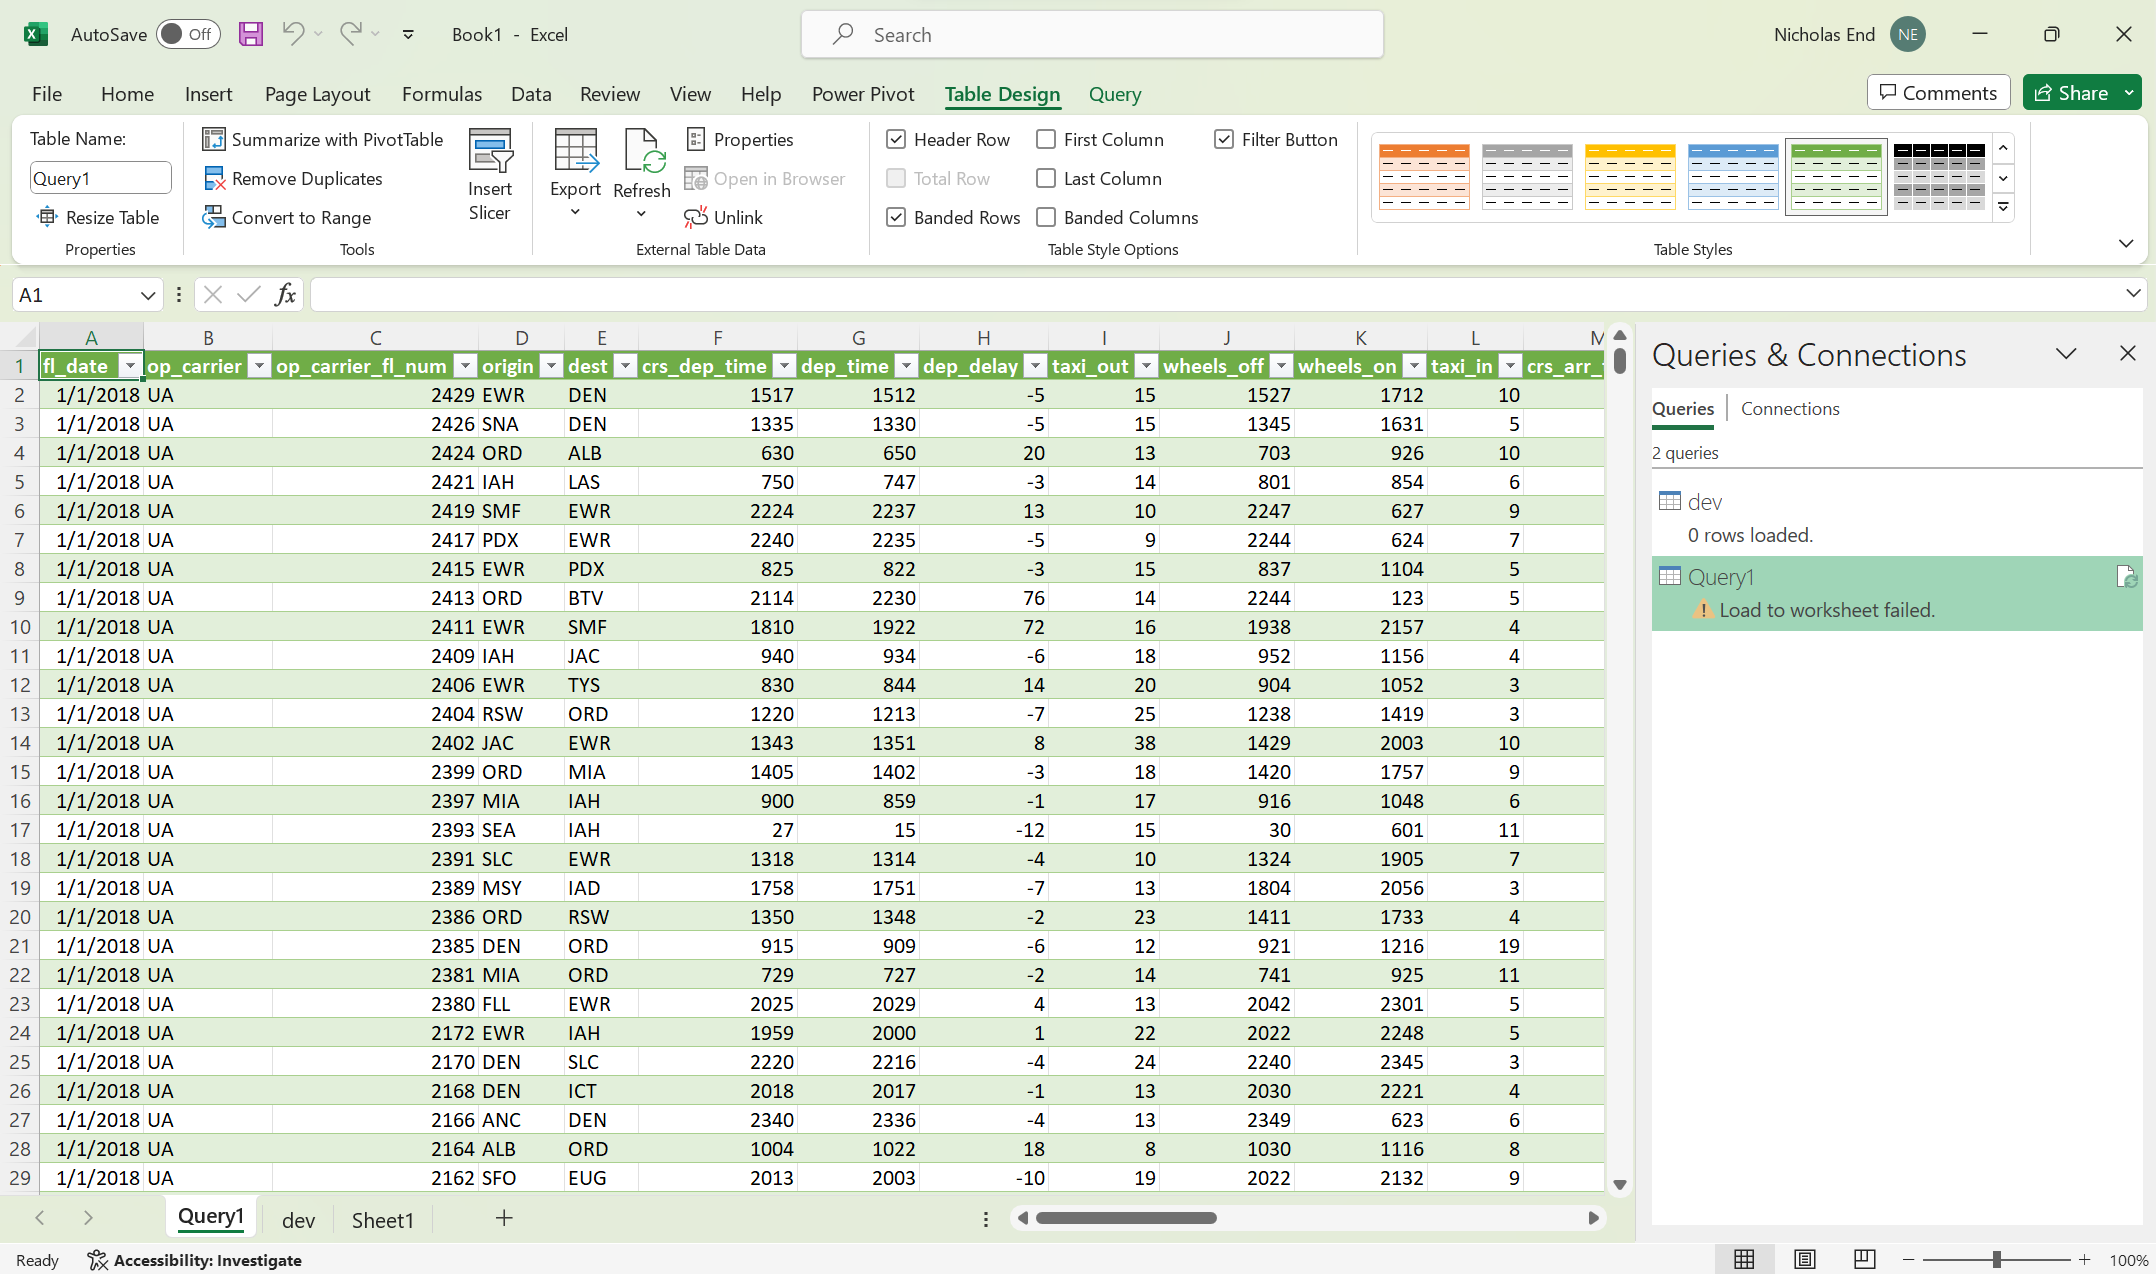
- Refresh Data: The data in Excel is not static; it's a live connection to your Redshift database. To refresh the data with the latest information, right-click on any cell in the imported data range and choose "Refresh" or use the "Refresh All" option.
Congratulations! You've successfully connected Redshift to Excel using Power Query. This method provides a dynamic link between your Redshift data and Excel, ensuring that any changes in the database are reflected in your spreadsheet in real-time.
Power Pivot
Connecting Redshift to Excel using Power Pivot allows you to create powerful data models and perform advanced analyses. Here's a step-by-step guide:
- Open Excel: Launch Microsoft Excel on your computer.
- Power Pivot Tab: Go to the "Power Pivot" tab on the Excel ribbon. If you don't see this tab, you may need to enable the Power Pivot add-in. To enable Power Pivot:
- Click on "File."
- Click on "Options."
- In the Excel Options dialog box, go to "Add-ins."
- In the Manage box, click "COM Add-ins" and then click "Go."
- Check the "Microsoft Office Power Pivot" box and click "OK."
- Power Pivot Window: In the Power Pivot tab, click on Data model This will open a new window specifically for Power Pivot.
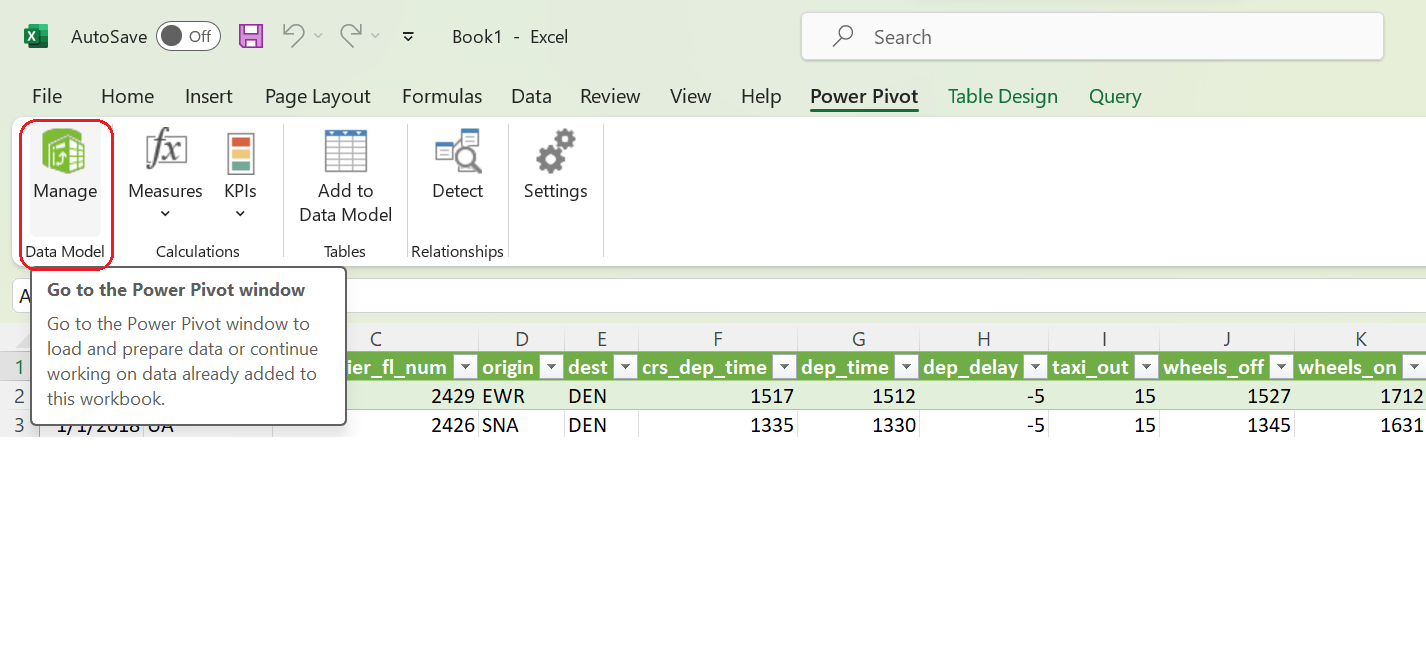
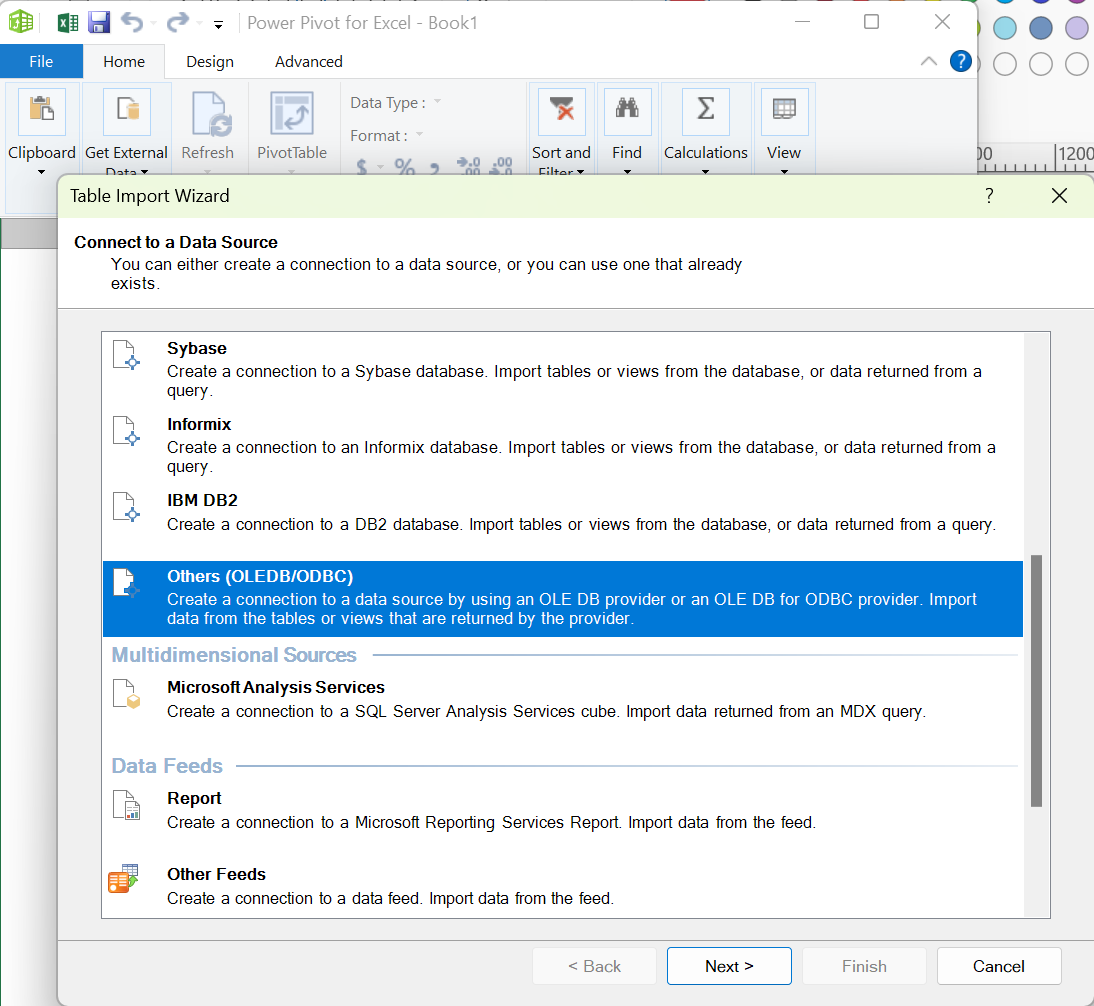
- Get External Data: In the Power Pivot window, click on "Get External Data" and choose "From Other Sources."
- ODBC Connection: Select "ODBC" as the data source type.
- ODBC Connection Manager: In the ODBC Connection Manager, choose "Machine Data Source" and select the Redshift ODBC driver you installed earlier.
- Enter Connection Details: Enter the connection details for your Redshift database, including Server, Database, Username, and Password. Click "OK" to establish the connection.
- Select Tables and Views: After connecting, select the tables or views you want to import into Power Pivot. Click "Next" to proceed.
- Choose Data Import Options: Configure data import options as needed. You can choose to import data into the Power Pivot data model or create a linked table.
- Finish Import: Click "Finish" to complete the import process. The selected data will be loaded into the Power Pivot window.
- Create Relationships: If your dataset involves multiple tables, create relationships between them in the Power Pivot window. This step is crucial for building effective data models.
- Close and Apply: Once you've configured relationships and made any necessary adjustments, click "Close & Apply" to load the data into the Excel workbook.
- Build PivotTables and PivotCharts:
- Return to the Excel worksheet, and you can now build PivotTables and PivotCharts based on the data imported from Redshift using Power Pivot.
- Remember that Power Pivot provides a dynamic connection to your Redshift data, allowing you to create sophisticated data models and conduct in-depth analyses directly within Excel. Refresh the data to keep it up-to-date with changes in your Redshift database.
Microsoft Query
- Launch Microsoft Excel on your computer.
- Go to the "Data" tab on the Excel ribbon.
- Click on "Get Data" or "Get & Transform Data" (depending on your Excel version).
- Choose "From Other Sources" and then select "From Microsoft Query."
- In the Choose Data Source dialog, select "ODBC DSN" and choose the Redshift ODBC DSN you configured earlier. The Query Wizard will open. Click "OK" to proceed.
- In the Query Wizard, select the Redshift tables or views you want to import into Excel. Click "Next" to continue.
- (Optional) You can specify criteria for data retrieval if needed. Click "Next" when ready.
- (Optional) If desired, you can specify a sort order for the data. Click "Next" to proceed.
- Complete the Query Wizard by clicking "Finish." You'll be prompted to choose how you want to view the data. Choose whether to import the data into a table, create a PivotTable, or view the data in Microsoft Query. Make your selection and click "OK."
- Once you've configured your query, click "Return Data to Excel." The selected data will be imported into Excel.
- The data in Excel is not static; it's a live connection between Excel and Redshift. To refresh the data with the latest information, right-click on any cell in the imported data range and choose "Refresh" or use the "Refresh All" option.
Congratulations! You've successfully connected Redshift to Excel using Microsoft Query. This method allows you to create a dynamic link between your Redshift data and Excel, providing real-time access to your database.
Download and Open Redshift CSV in Excel
Opening a CSV extract from Redshift is the simplest way to get data from a Redshift database into Excel. The downside is this method doesn't establish a live-connection and Excel may have some issues if you try to open a large csv.
- Run Query: In your Redshift database tool (e.g., SQL Workbench), run a query to select the data you want to export.
SELECT * FROM your_table;
- Export to CSV: After running the query, export the result set to a CSV file. You can typically do this from the query tool's interface. Ensure that the CSV file contains headers.
- Open Excel: Launch Microsoft Excel on your computer.
- Data Tab: Go to the "Data" tab on the Excel ribbon.
- Get Data: Click on "Get Data" or "Get & Transform Data" (depending on your Excel version).
- From Text/CSV: Choose "From Text/CSV" and select the CSV file you exported from Redshift.
- Text Import Wizard: The Text Import Wizard will appear. Choose "Delimited" and click "Next."
- Specify Delimiters: Select the delimiter used in your CSV file (e.g., comma) and click "Next."
- Column Data Format (Optional): Adjust the column data format if needed. Click "Finish" when ready.
- Load Data: Choose whether to load the data into a table, create a PivotTable, or load the data directly to a worksheet. Make your selection and click "OK."
When you export a Redshift CSV to Excel, you're transferring a static file, so there is no true connection established. You'll need to repeat the process any time you want to import new data from Redshift to Excel.
Better Option - Connect Redshift to Row Zero
Row Zero is an enterprise-grade spreadsheet that works like Excel but can open billion row datasets (1000x Excel's row limit) and easily connects to Redshift in seconds with a built-in Redshift connector. You can easily build connected spreadsheets that auto-update. Everything built on Redshift data tables can be set to stay in sync and auto-update including pivot tables, charts, formulas, dashboards, etc.
There are 3 steps to easily connect Redshift to Row Zero and analyze data in a spreadsheet. Follow the instructions below to get started.
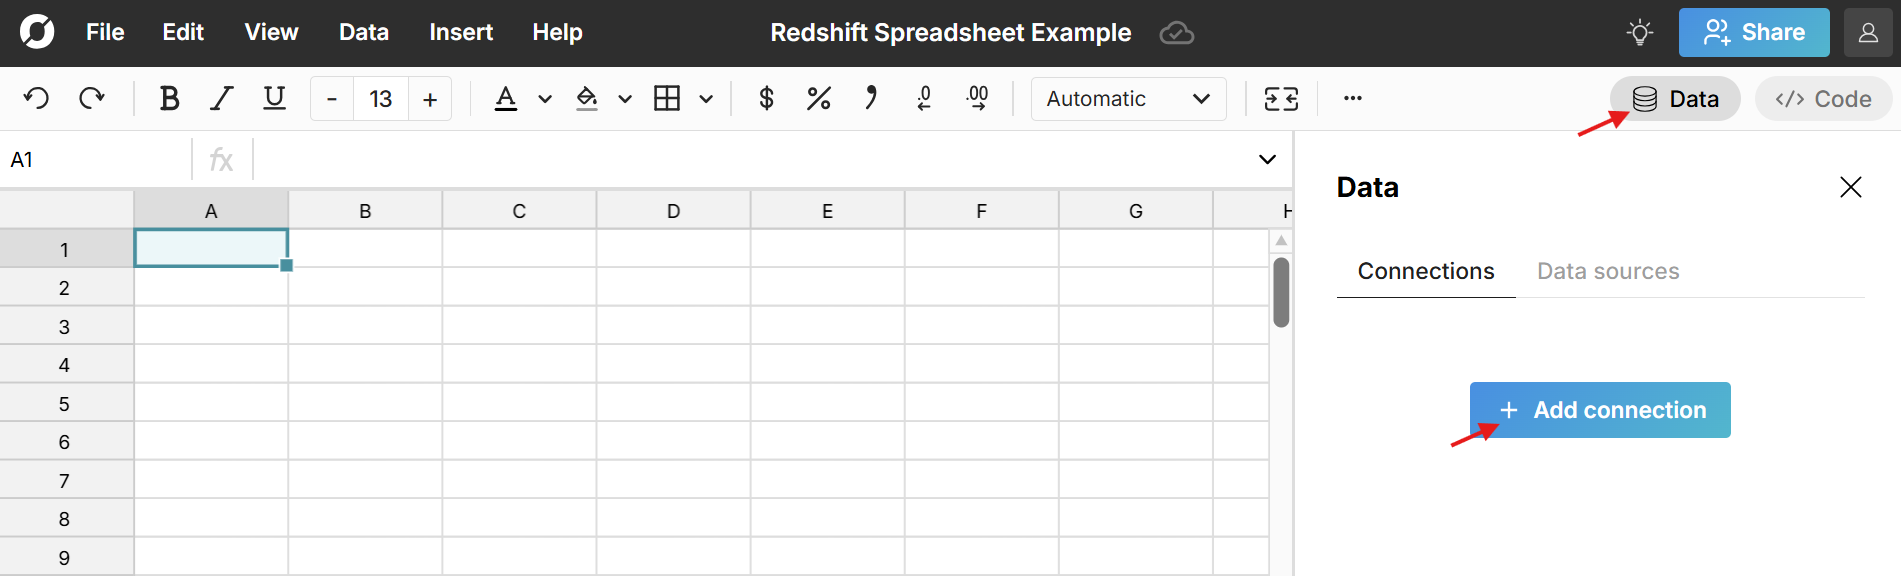
- Connect Row Zero to your Redshift account: Click the 'Data' icon in the top right of your workbook, click 'Add connection', select Redshift, and enter your connection details.
- Write a query to import data: Click the '+' sign next to your Redshift connection to open a query editor. Write your query, click 'Run', and your Redshift data imports to a connected table.
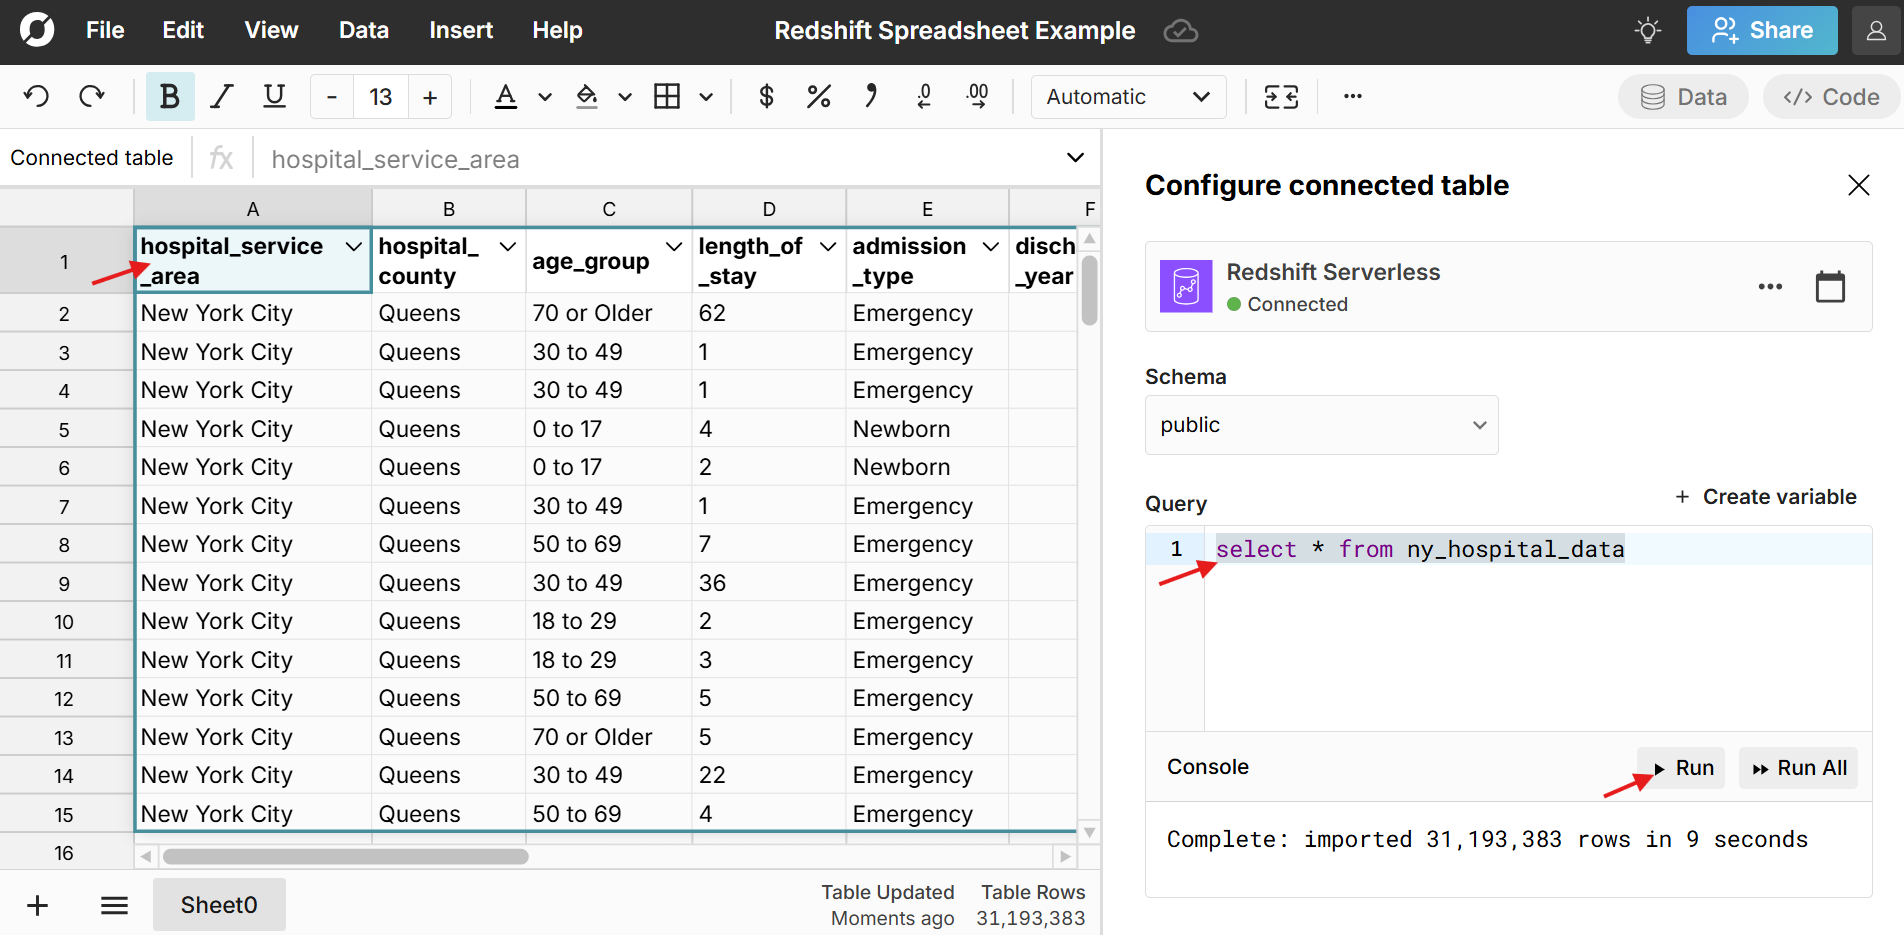
- Build out your Redshift connected spreadsheet: Row Zero works like Excel and Google Sheets and everything you build on top of connected data stays in sync and dynamically updates, including pivot tables, charts, formula functions, etc. Here's more info on how to build connected spreadsheets.
Pros and cons of connecting Redshift to Excel
Pros
Connecting Excel to Redshift offers several benefits, enhancing data analysis capabilities and streamlining workflows. Here are some key advantages:
- Live Models and Dashboards: The integration facilitates the creation of live models and dashboards directly within Excel. You can build dynamic models that automatically update as new data is added to Redshift, providing a dynamic and interactive reporting environment.
- Enhanced Data Visualization: Excel's robust visualization capabilities can be leveraged to visualize Redshift data. You can create charts, graphs, and other visual representations of your data within Excel, making it easier to interpret and communicate insights.
- Familiar Interface: Excel provides a user-friendly interface that is familiar to many professionals. Connecting Redshift to Excel allows users in operations, marketing, finance, and business intelligence to leverage the power of a sophisticated data warehouse without the need for extensive training in complex tools.
- Flexibility in Analysis: Excel's versatile features empower users to perform various analyses on Redshift data, from basic calculations to advanced statistical modeling. This flexibility ensures that analysts can tailor their approach to the specific requirements of their analysis.
In summary, connecting Redshift to Excel enhances the agility and efficiency of data analysis, offering real-time insights, collaboration opportunities, and a familiar interface for users.
Cons
Before embarking on the connection journey, it's essential to be aware of potential draw-backs of connecting Excel to Redshift. This section will address factors such as data set size, performance limitations of Excel, security risks, and the complexities involved in connecting Excel to Redshift.
Data Set Size: Excel spreadsheets don't support the big datasets common in data warehouses like Redshift. Excel has a 1,048,576 row limit. To import data from Redshift to Excel, the Redshift query will need to trim the data down to a size that Excel can manage. There are options within Microsoft Excel, like data model and power query, to enable working with large data sets but they don't allow users to see all the data or use the same spreadsheet flexibility Excel supports with smaller data sets. If you are working with a large data set or Excel is too slow, consider using a more powerful spreadsheet like Row Zero.
Security risks: Importing data from Redshift to Excel poses an information security risk because the data is moving from a cloud data warehouse where activity is traceable and behind layers of security to a locally stored Excel file stored on a computer. Once the data is in Excel, that data goes wherever the computer goes. The computer could be lost, stolen, or shared. The file could also be emailed to someone unauthorized to view the data. And it's virtually impossible to comply with privacy regulations if customer data is stored locally on computers. A more secure option is a cloud based spreadsheet, like Row Zero, that is specifically built for connecting to cloud data sources.
Complexity: Connecting Redshift to Excel takes a lot of steps and is pretty daunting for non-technical users. Rather than dealing with a lot of steps and workarounds, try Row Zero, which has a built-in Redshift connector and makes it easy to import entire Redshift tables into your spreadsheet. You can leverage spreadsheet features to filter, sort, and analyze Redshift data rather than writing complex SQL and re-running queries.
Conclusion
We reviewed how to connect Excel to Amazon Redshift with an ODBC driver and how to import data from Redshift to Excel spreadsheets. Connected spreadsheets are a big win for efficiency but they can be a challenge to set up in Excel. Excel's performance limits can also make it challenging to work with large Redshift datasets. If you're looking for an easier way to connect Redshift to a spreadsheet or you're hitting the performance limits of Excel, try Row Zero. Row Zero is a powerful spreadsheet with a built-in Redshift connector that lets you build big, auto-updating spreadsheets.
If you use another cloud data warehouse or blob storage, Row Zero also connects to Snowflake, Databricks, BigQuery, Postgres, and S3.