The AWS Cost and Usage Report (CUR) provides detailed insights into your AWS charges, offering granular data on costs, usage, and resource consumption. These files are typically very large and are exported as parquet or CSV.gz, so you can't easily open AWS CUR in Excel or Google Sheets. Row Zero is a next-gen spreadsheet built for big data that makes it easy to open and analyze CUR in a spreadsheet. You can import via file, presigned URL, or sync to S3 to easily access the latest files or combine multiple CUR files.
In this guide, we breakdown AWS Cost and Usage Reports and show how to open AWS CUR and analyze in a big spreadsheet.
- What is a Cost and Usage Report?
- How to Open AWS CUR in a spreadsheet
- Connect to S3 to access latest files and combine multiple CUR files
- How to set up a CUR in AWS Billing
- Analyze your Cost and Usage Report
- Conclusion
What is a Cost and Usage Report?
A Cost and Usage Report (CUR) is a detailed AWS billing report that provides a comprehensive view of AWS costs and resource usage. The CUR includes metadata such as account IDs, service names, operation types, and pricing models, making it an essential tool for financial tracking and cloud cost optimization.
How to Open AWS CUR in a Spreadsheet
Row Zero easily opens CUR files with a simple file import, presigned URL, or an S3 connection. Row Zero is 1000x more powerful than traditional spreadsheets and can open large file formats including parquet and CSV.gz files. Here's how to open AWS cost and usage reports in Row Zero:
Create a Cost and Usage Report
Login to the AWS Billing and Cost Management console to create and access your Cost and Usage Reports. If you've already created your report, you can choose to download as parquet or CSV.gz or share with a presigned URL. You can also connect to S3 to easily access the latest files or open multiple files at once. If you need help creating a CUR, view instructions below.Open up a workbook in Row Zero
Login or sign up for free and open a workbook.Import your CUR file: In the top navigation, click Data to import a CUR file directly from your computer, a URL, or Amazon S3.
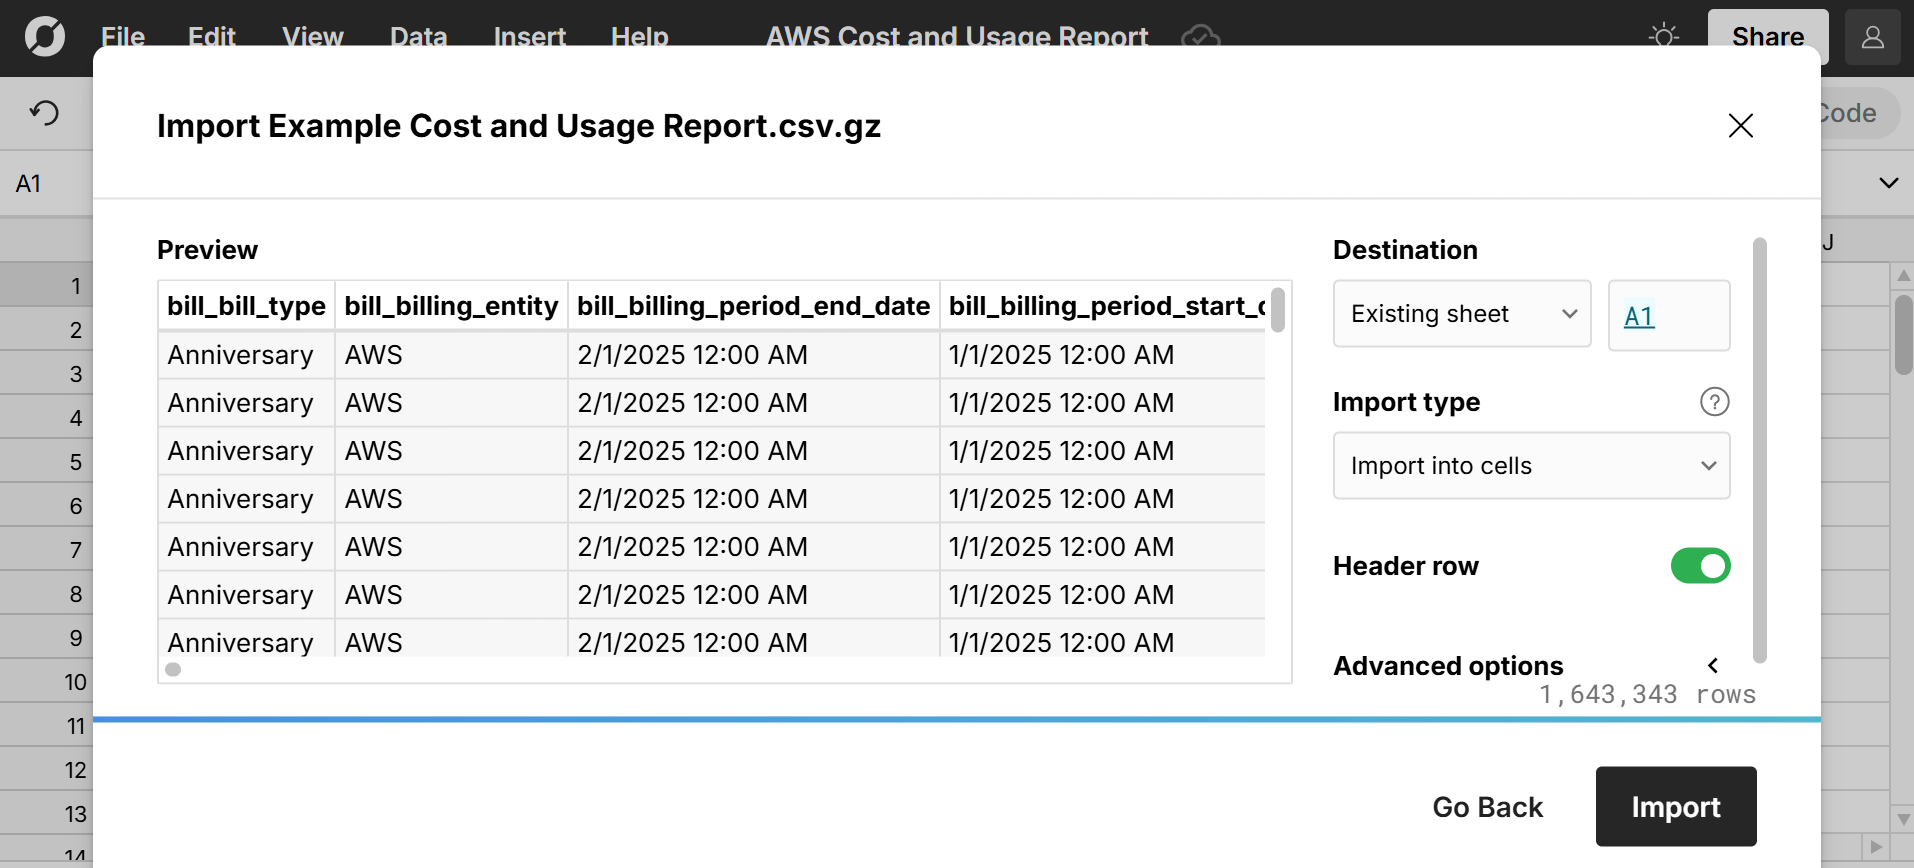
View and analyze your Cost and Usage Report as a spreadsheet
Your Cost and Usage Report is now a Row Zero spreadsheet. You can filter, sort, write formulas, create pivot tables, and chart to analyze AWS charges and usage.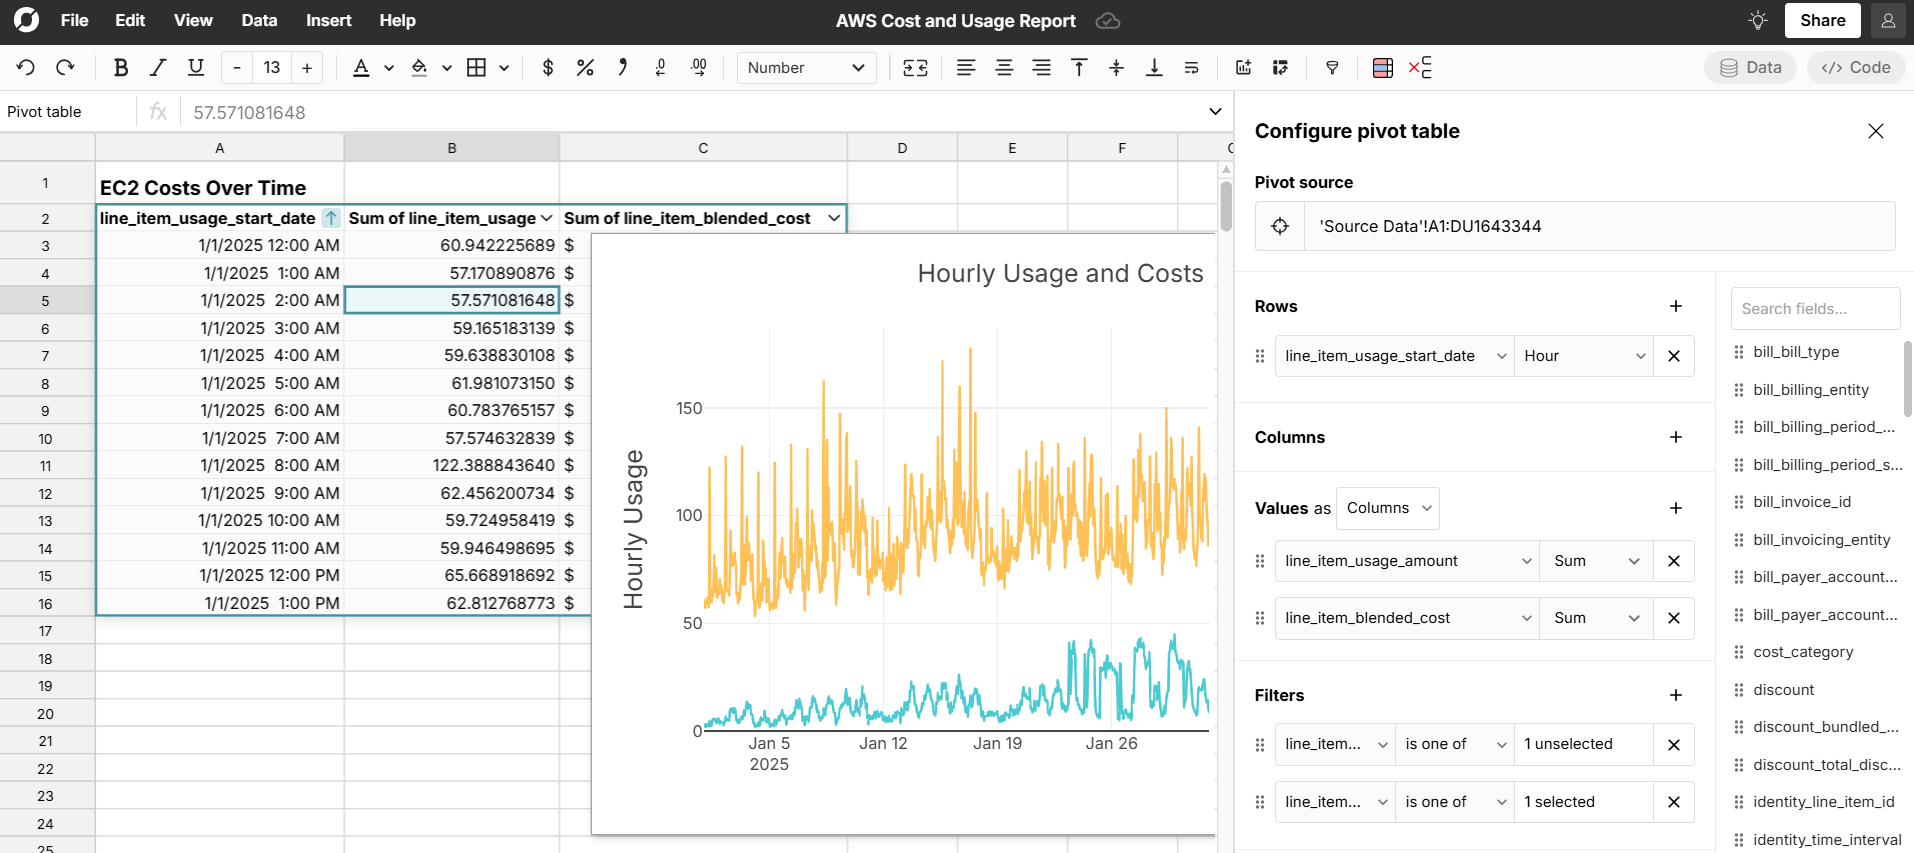 See below for tips on how to analyze your CUR.
Connect to S3 to easily get the latest files and combine multiple files
If you plan to regularly access your AWS cost and usage report, you can connect Row Zero to your S3 bucket to make the latest files easily available for import at any time. Here's how to connect to S3 in Row Zero. Once your S3 bucket is connected in Row Zero, you can go to Data, Import from Amazon S3 to access files in your S3 bucket. 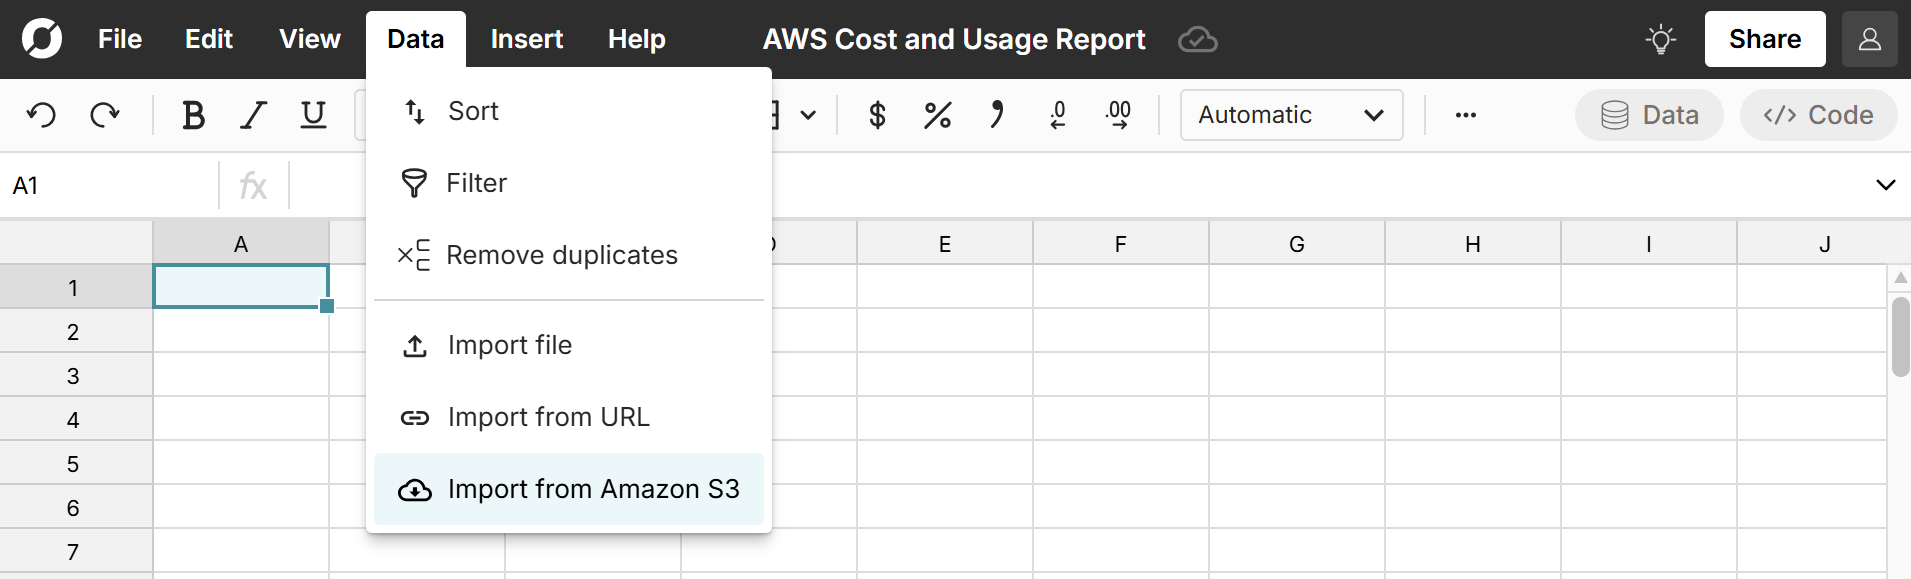 You can also combine, merge, and concatenate S3 files into one spreadsheet. Simply navigate to any folder and select the CUR files to combine. Row Zero will merge multiple CUR files and concatenate them into one worksheet.
How to set up a Cost and Usage Report in AWS Billing
It's easy to create Cost and Usage Reports for export. We outline the steps below, but suggest viewing the AWS Data Exports User Guide for details on how to create and export various cost and useage reports (CUR 2.0, Legacy CUR, FOCUS 1.0).
- Login to the AWS Billing and Cost Management console. Select the export type, name, and data table (CUR 2.0, Cost optimization recommendations, FOCUS 1.0 with AWS columns).
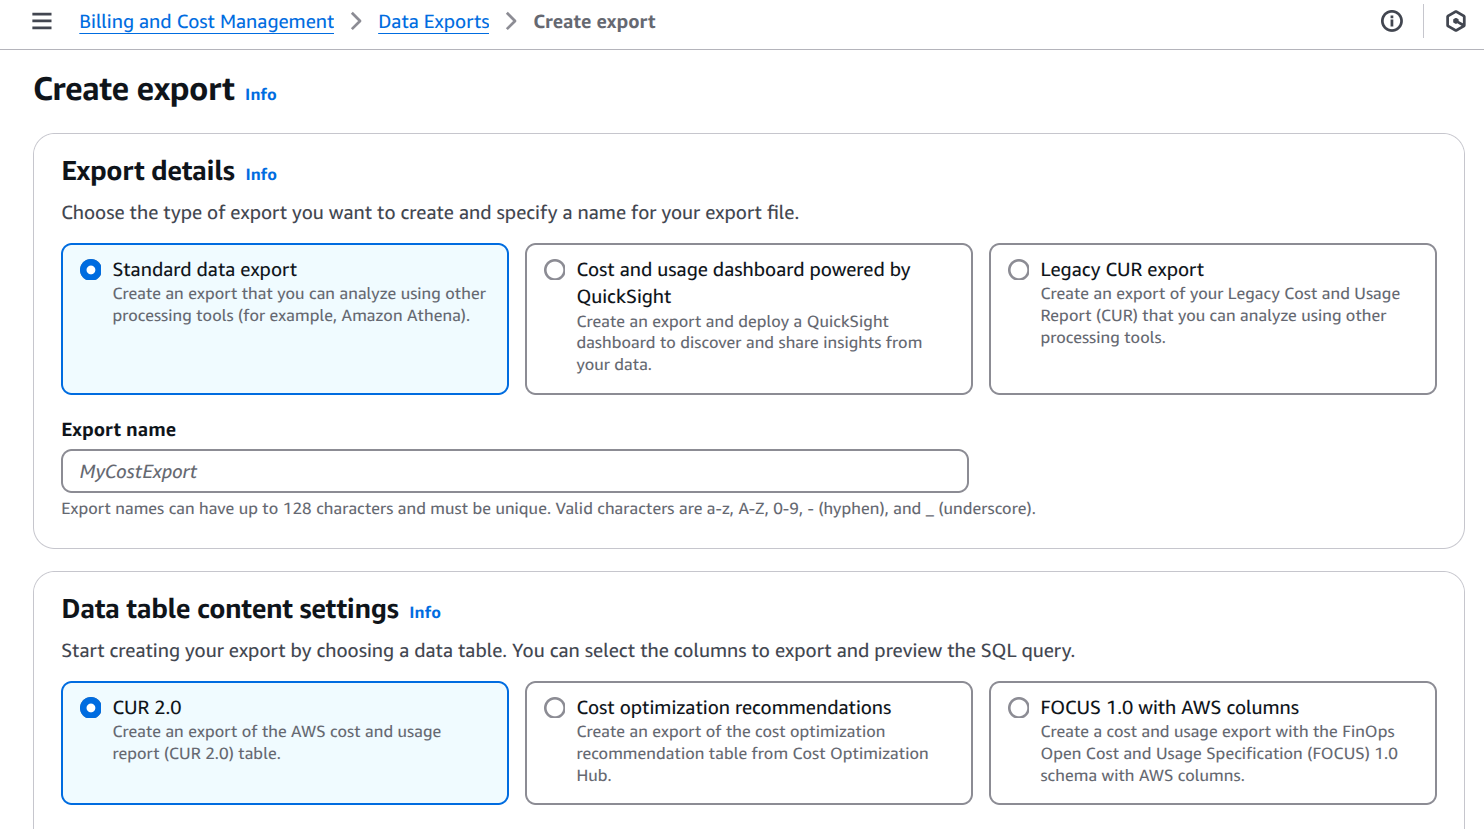 Since Row Zero can open very large files, you can export the full dataset by selecting Include resource IDs, Split cost allocation data, and Hourly for time granularity.
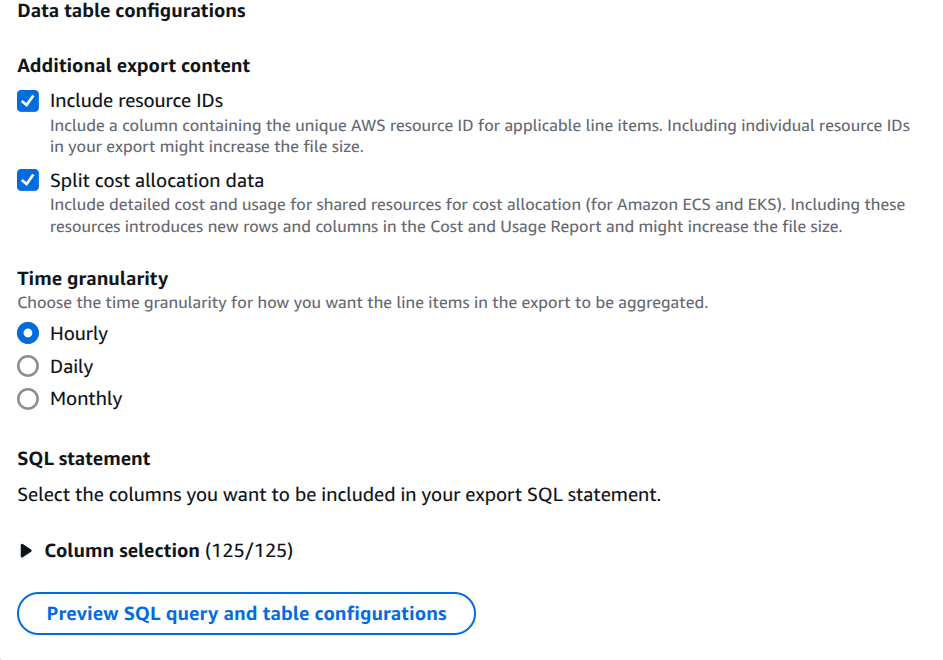
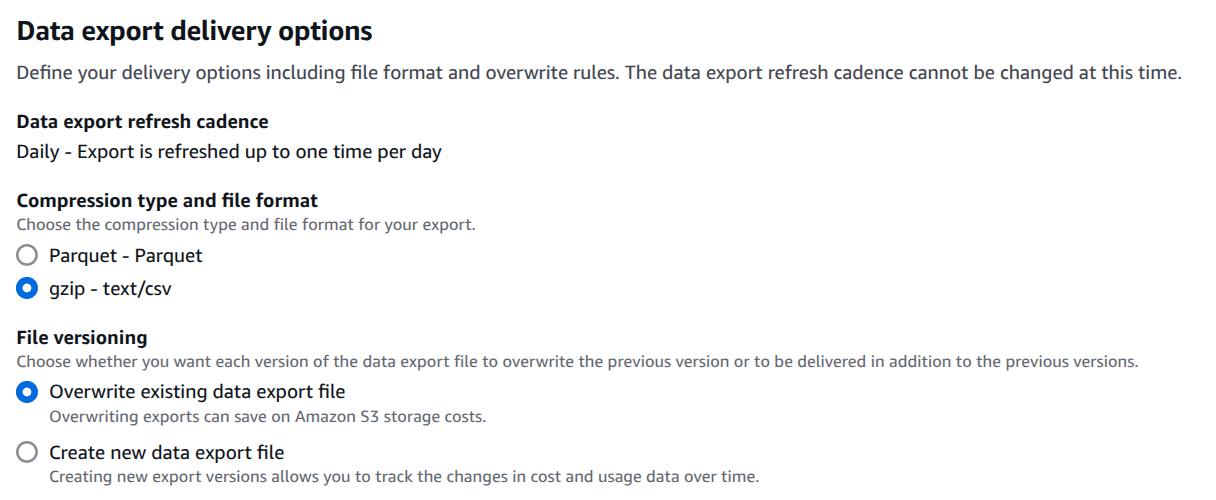
- Select your data export delivery options. You can choose to export as Parquet or gzip. Row Zero supports both file types.
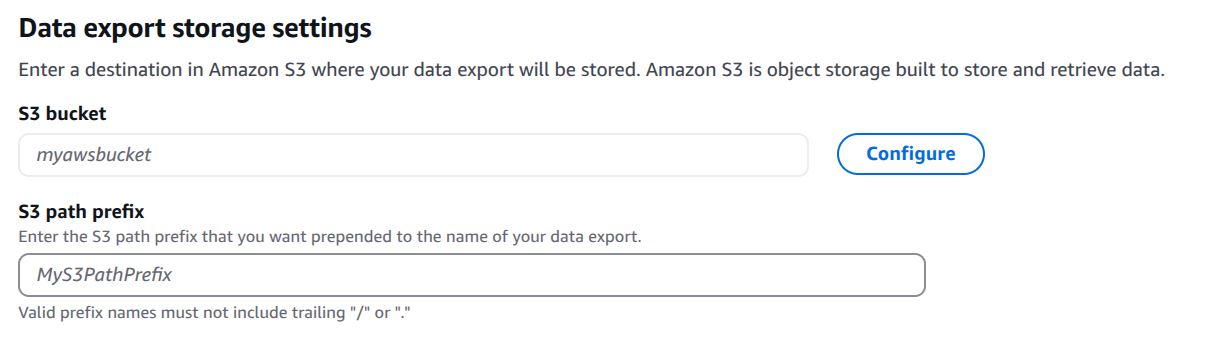
- Enter the S3 bucket where your data export will be stored along with the S3 path prefix. Note, the first time you create a CUR, it can take several hours for the file to be available. Future files are available daily.
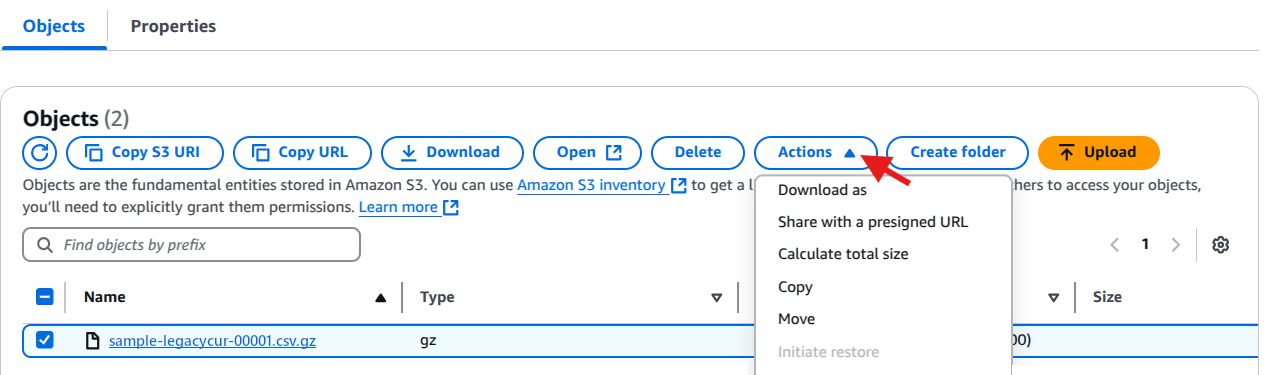
- Once your file has been created, go to your S3 bucket, select the CUR file, click the Actions button and then either Download as or Share with a presigned URL. Row Zero supports either option.
- Import into Row Zero - you can open your CUR file in Row Zero by going to a new workbook and clicking Data in the header. Here you can choose to import a file, URL, or connect to an S3 bucket directly.
Analyzing your Cost and Usage Report
Typical AWS Cost and Usage Report
A typical AWS CUR can be millions of rows and contain dozens of columns that detail AWS billing data, such as:
- Account Information: Identifies which AWS account is associated with the charges.
- Service and Region: Specifies which AWS services were used and in which geographic region.
- Usage Type and Operation: Defines the specific service operation that incurred costs.
- Pricing Information: Shows AWS cost breakdowns by product, including discounts, credits, and reservations.
- Tags and Metadata: Helps categorize costs by project, team, or environment.
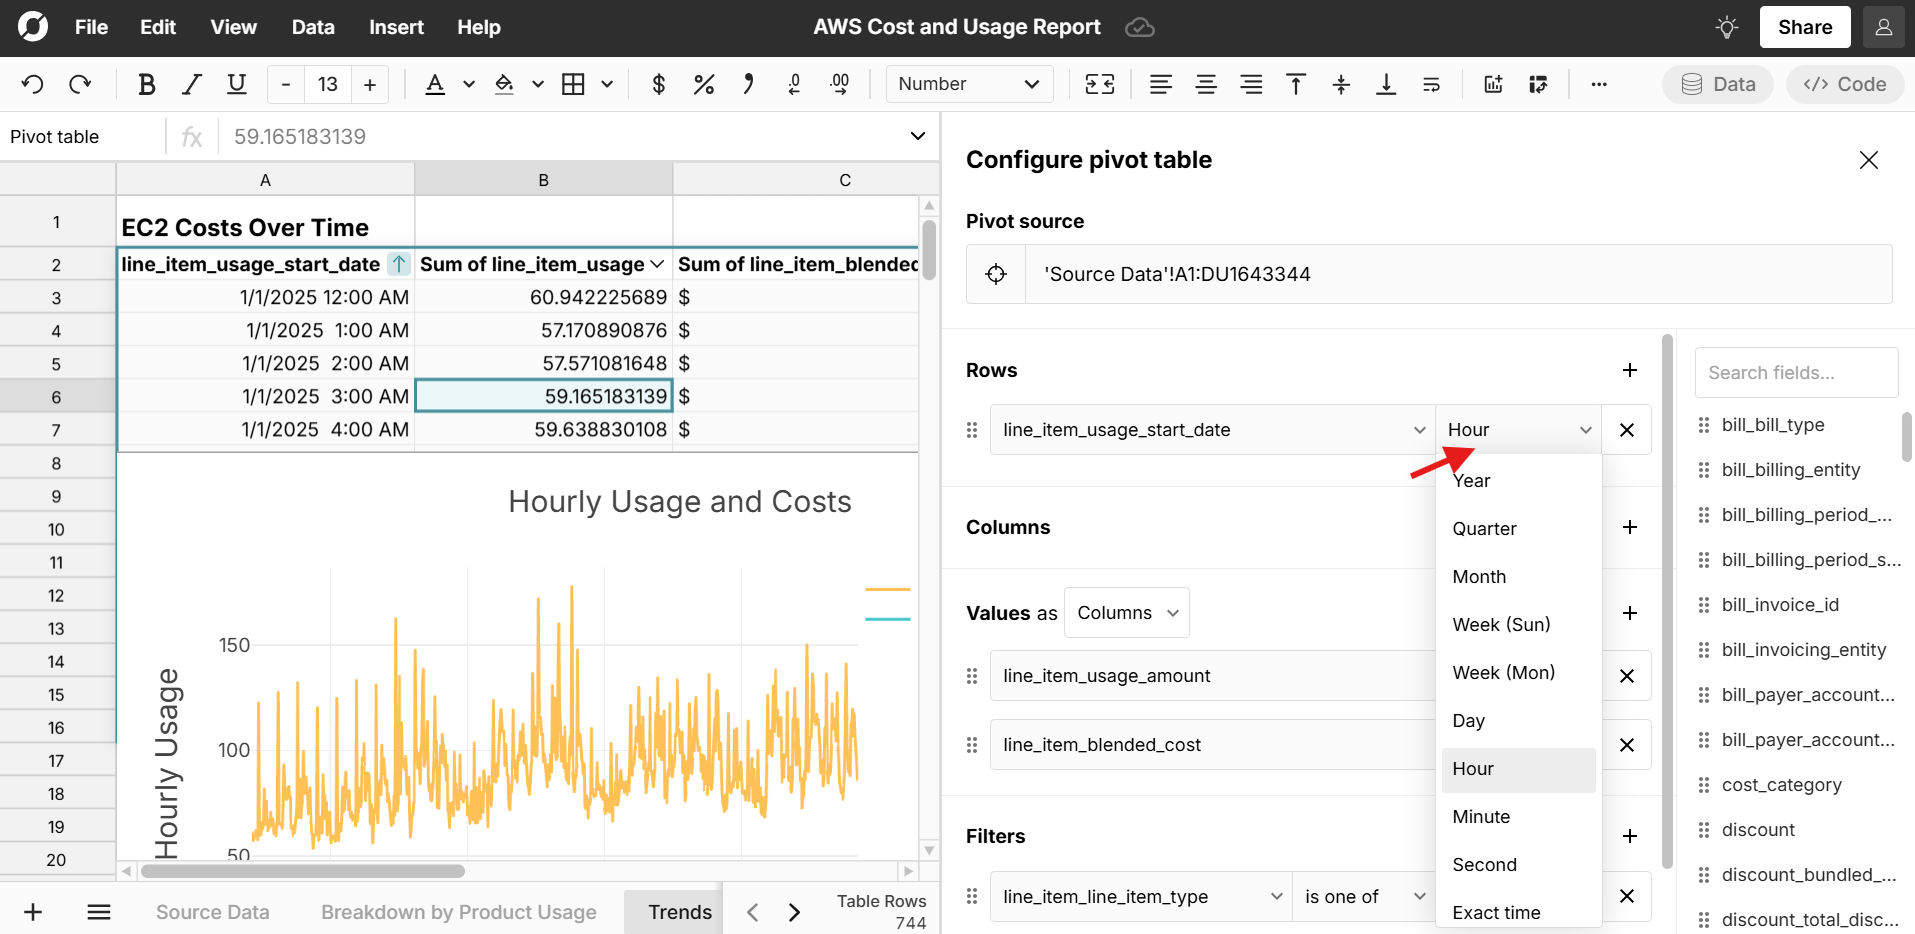
Pivot and chart cost and usage over time
Given the size of the raw CUR data, a good first step is to create pivot tables and charts to summarize and visualize the data. Pivot tables can summarize AWS cost trends by service, region, or account. Row Zero pivot tables can aggregate datetimes as hour, day, week, month, etc. and you can chart this data to easily identify cost spikes or potential issues.
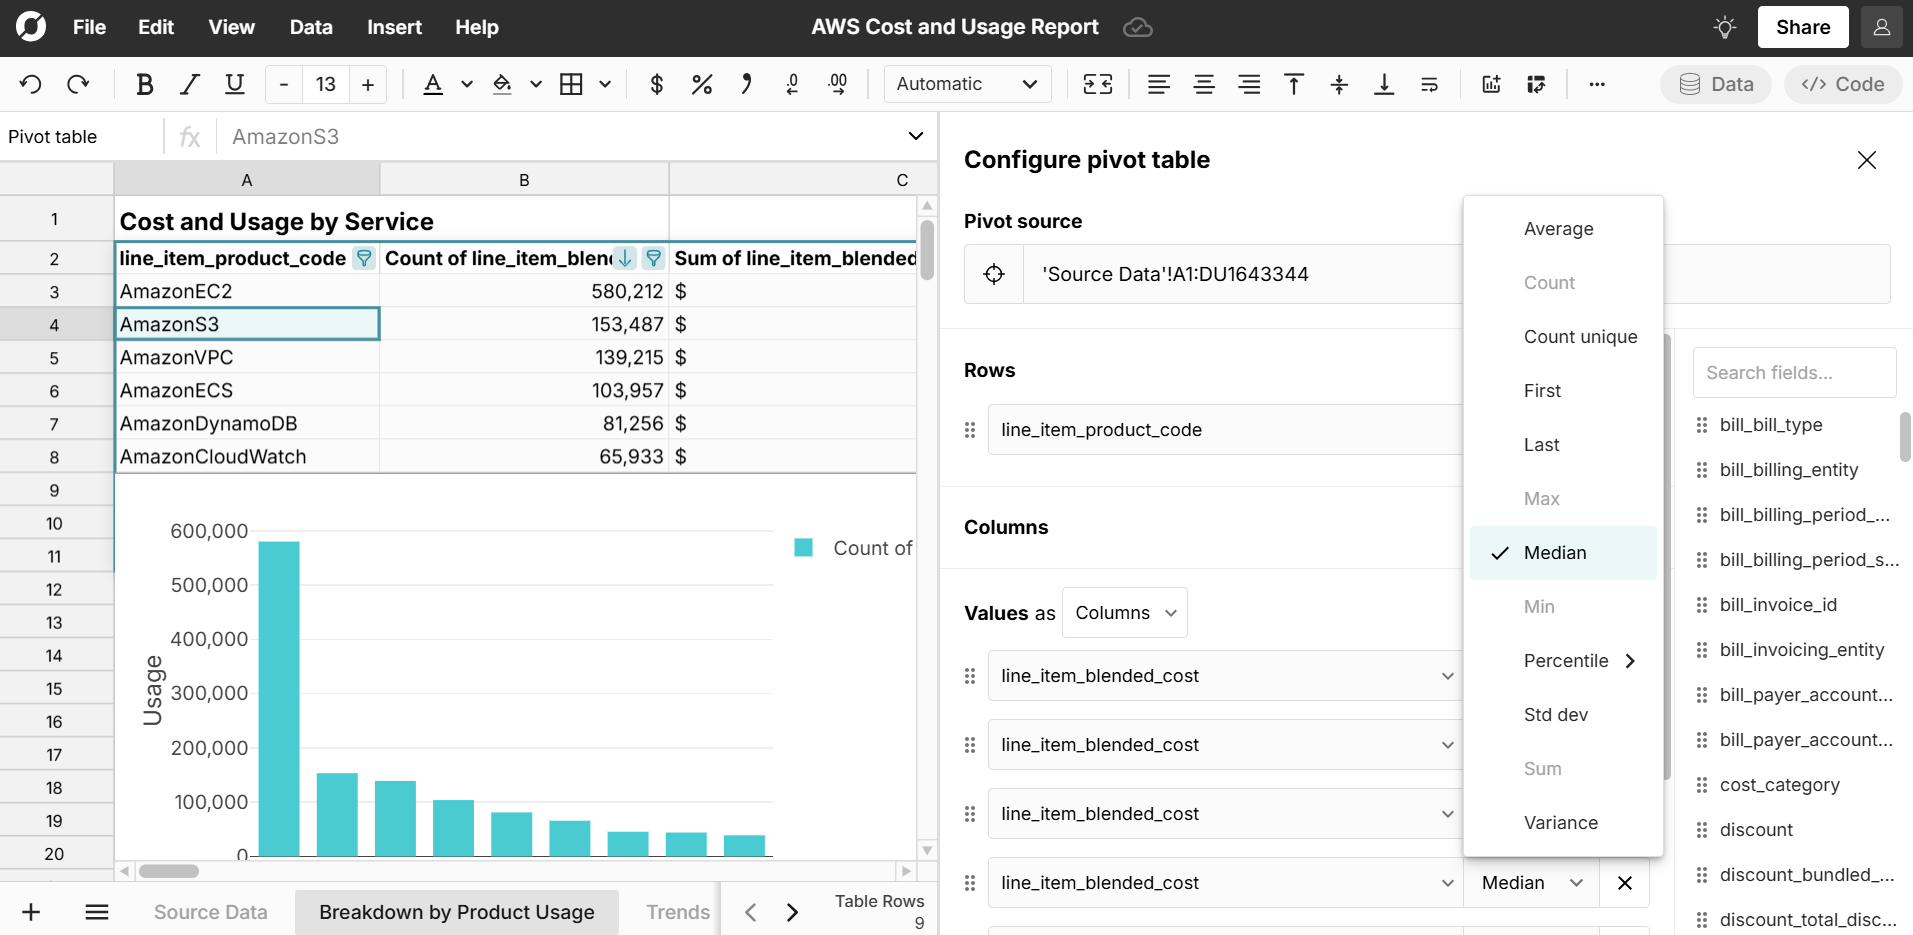
Analyze costs by service, region, and tag
You can similarly create pivot tables to summarize costs by service or region to see what contributes most to your AWS costs and usage. You can also group costs by tagging if you use AWS cost allocation tags to categorize expenses.
Conclusion
By effectively leveraging AWS CUR, organizations can optimize their cloud spending, forecast AWS budget, and make data-driven decisions to manage cloud costs efficiently. Cost and Usage Reports are typically exported as parquet or CSV.gz files and are very large, so you cannot easily open CUR in Excel or Google Sheets. Row Zero is a powerful spreadsheet that makes it easy to open big CUR files and analyze them in an easy to use spreadsheet.