Looking for a way to analyze National Provider Identifier, or NPI data? Row Zero is a next-gen spreadsheet that allows you to view and analyze large healthcare data sets, including public Medicare Provider Enrollment files and NPI registry data.
CMS publishes Medicare Provider Enrollment data that contains NPI data and other information about all physicians, individual healthcare providers, and organizations enrolled with Medicare. This includes nearly all non-pediatric physicians in the United States.
CMS notes on its site that spreadsheets typically can’t handle provider enrollment files, due to the amount of data contained in these files:
This full dataset contains more records than most spreadsheet programs can handle, which will result in an incomplete load of data. Use of a database or statistical software is required.
However, Row Zero can easily handle millions of rows of provider NPI data in a familiar spreadsheet format with excellent performance. We’ve created a template with the latest CMS Medicare Provider Enrollment data preloaded, along with a few exploratory data analysis templates to help get you started working with NPI data.
Click here to learn more about the template or click here to dive right into the data.
Open Medicare Provider Enrollment file
Table of Contents
- What is NPI data?
- What can I do with NPI data?
- Notes on working with the Medicare NPI database
- What is in the Row Zero NPI database template?
What is NPI data?
An NPI (National Provider Identifier) is a unique, 10-digit identification number assigned to healthcare providers and organizations in the United States by the Centers for Medicare & Medicaid Services (CMS). NPI is used to standardize provider identification across billing, electronic medical records, insurance claim data and many other types of data involving individual clinicians and organizations. Because nearly every physician and billable clinician working in the United States comes into contact with Medicare in one way or another, NPI databases provide a fairly comprehensive view of individual healthcare providers in the U.S.
CMS maintains the NPI registry as part of the National Plan and Provider Enumeration System. Physicians and organizations planning to bill Medicare or order and refer for services that will be billed to Medicare must enroll with Medicare in addition to obtaining a National Provider Identifier (NPI) ID.
What can I do with NPI data?
In this post, I’m concentrating on individual clinician NPI data specifically, not organizational NPI data. However, the CMS Medicare Provider Enrollment dataset (and our Row Zero template) contains both.
You can use NPI data to explore questions like the examples below. Click here to learn more about the Row Zero template or click here to jump into the template and start exploring on your own.
Which physician specialties are the most common?
Because an NPI database provides a comprehensive view of provider specialties, NPI data shows the prevalence of specific provider specialties. For instance, there are 515 enrollments of “Undersea and Hyperbaric Medicine” specialists.
A lot of the most common specialties are more general “specialties” that you’d expect to see, like Nurse Practitioner, Physician Assistant, and Family Practice. However, there are also specialties that are probably more common than you would think, like CRNAs and Anesthesiologists at 10th and 11th most prevalent, respectively.
Which physician specialties have the largest gender disparities?
Large gender disparities still exist in many physician specialties. The gender disparity is particularly acute in a lot of surgical and cardiac specialties, where over 70% of many specialties are male. It should be noted that a significant amount of Medicare enrollments have missing or unknown gender data. 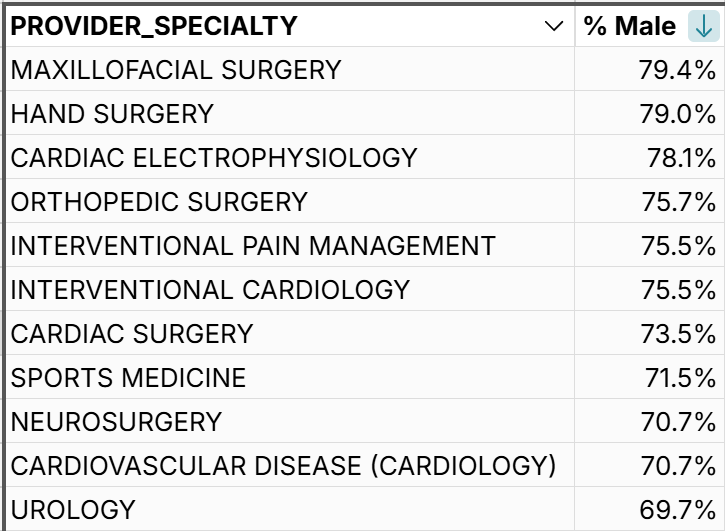
Which states have the most physicians per capita and how does it correlate to state life expectancy?
Another interesting thing to look at is providers per 1000 residents in each U.S. state. You can also filter this data by specialty to see things like which state has the highest number of Pain Management specialists per 1000 people (New Jersey and Delaware). We’ve also included CDC state life expectancy data so you can look at the correlation of providers per 1000 people to state life expectancy (DC is removed in the graph below as an outlier). A lot of the northeastern states (Vermont, Maine, Massachusetts, Connecticut, and Rhode Island) with the highest number of providers per 1000 residents also have the highest life expectancy. 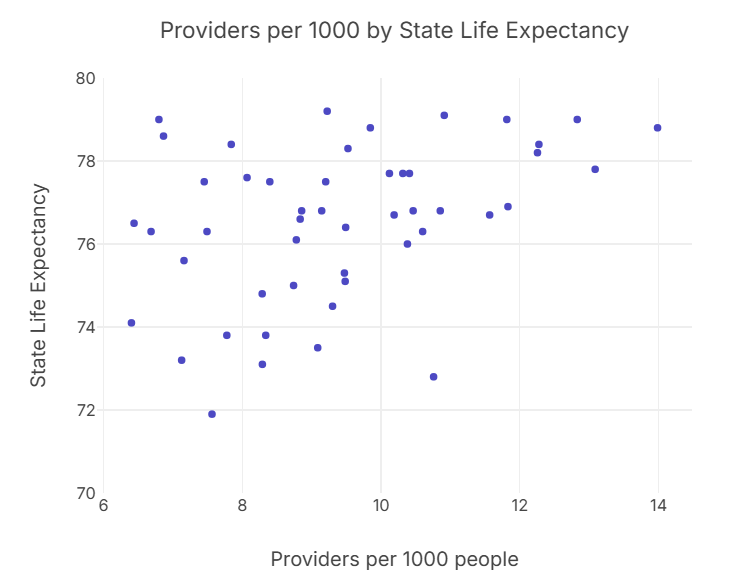
Notes on working with the Medicare NPI database
CMS publishes an excellent data dictionary that thoroughly explains all of the files contained in the provider enrollment dataset. All of the files are loaded into the Row Zero template. Here are a few particularly useful things to keep in mind when working with this NPI data:
- Enrollment ID (ENRLMT_ID) is the field that links each of the files together. In the Row Zero template, you'll see lots of XLOOKUPs using ENRLMT_ID as a key. If you aren’t familiar with XLOOKUP, you can check out our guide to using XLOOKUP.
- An individual or organization may appear in multiple enrollments (for things like enrolling in different states). PECOS_ASCT_CNTL_ID maps closely to a Social Security Number for an individual or an EIN for an organization and can be used to track the same person or entity across multiple enrollments.
- The first 2 characters of the PROVIDER_TYPE_CD field can be used to identify different types of enrollments:
- 00 - inpatient facilities (hospitals, skilled nursing facilities, etc.)
- 12 - outpatient suppliers
- 14 - providers
- 30 - DME suppliers
- 33 - Ordering and referring only providers
- In the GNDR_SW column for individual providers, a value of “9” means “Unknown.”
What is in the Row Zero NPI data template?
The Row Zero NPI Data Template provides all of the raw files that are included in the CMS Medicare Provider Enrollment dataset, plus a few starter analysis templates.
In the template, you’ll see a tab corresponding to each of the 4 .csv files included in the CMS download. These 4 tabs are just the raw data from the latest set of files (descriptions below pulled directly from the CMS Medicare Provider Enrollment Data Dictionary):
- Enrollment Extract - This tab contains a unique listing of all provider enrollment applications that have been approved to bill or order and refer in Medicare.
- Location - This tab contains a unique listing of practice location city, state, and zip code for each enrollment.
- Secondary Specialty - This tab contains a unique listing of enrollment ID and secondary specialty information pairs, for practitioner and DME supplier enrollments.
- Reassignment Linkages - This tab contains a unique listing of enrollment ID pairs of individual providers reassigning their benefits and providers receiving the reassignment of benefits.
The remaining tabs in the template are pivot tables for the exploratory data questions above to get you started analyzing the data:
- Aggregated Specialty Data - This tab is an aggregation of individual billing providers and individual order and referring providers and all of their associated secondary specialty data. One row corresponds to a provider + specialty. In other words, if a provider has 3 specialties, you’ll see 3 rows on this tab. This makes counting specialties easier, given that one provider can have any number of specialties (a couple of providers list 20+ specialties!).
- Most Common Specialties - This tab is a pivot table of specialties and their counts, showing the percentage of total for each. Note that the denominator here is the total number of individual physicians listed in the file.
- Gender Disparities by Specialty - This tab is a pivot table of specialties, with genders as columns. Note that a “9” value for gender means “unknown.” There are columns for percentage of male and female for each specialty (with denominators including M + F + “missing” + “unknown”).
- Specialists by State - This tab is a pivot table of states with providers per 1000 people, with population and life expectancy pulled in from the State Data reference tab. There is a filter available on the pivot table to filter by specialty.
- State Data - This is a reference tab with state populations and state life expectancy data.