The Center for Disease Control (CDC) public data site contains a tremendous amount of free, accessible public health data from the United States. CDC Data contains over 1200 datasets across categories like Chronic Diseases, Global Health, and Forecasting and Outbreak Analytics. Many of these datasets are updated routinely and contain millions of rows of data. The most accessed datasets relate to COVID-19 statistics.
Using a Row Zero workbook to access CDC data allows you to view even the largest datasets (hundreds of millions of rows) in a single spreadsheet and use familiar spreadsheet features to explore and analyze the data. You can use spreadsheet formulas, visualize data in charts and graphs, and create pivot tables to slice and dice data any way you want. You can also use Python code in a Row Zero workbook to connect to CDC datasets via API to keep your data up to date and prevent the hassle of working with large files.
In the post below we provide instructions for connecting to the CDC data API and exporting data sets. We’ve also created a Row Zero template spreadsheet that allows you to explore a few CDC public datasets and connect to data.cdc.gov datasets via API to access and analyze any of the 1200+ datasets available.
Click here to open a Row Zero template that allows you to:
- Explore a few example CDC datasets related to flu, respiratory virus response, and COVID-19 cases.
- Connect directly to any available CDC dataset via API using a Python code template directly in the workbook.
Table of Contents:
- Exploring Sample CDC datasets
- Weekly Flu Admissions
- Flu Cases by State
- Wastewater Data
- Respiratory Virus Response
- Connecting to CDC Data via API
- Create a data.cdc.gov Account and AccessToken
- Find a Dataset Data Identifier
- Connect to the Dataset in a Row Zero Workbook
- Handling Large Datasets Using the CDC API
- Conclusion
Exploring Sample CDC datasets
In the template, I’ve pulled together a few sample CDC public datasets to get you started. The data in each of these sample datasets is available on data.cdc.gov and can be accessed via API for updated data. The steps for connecting to these and other datasets via API is outlined in the next section. Each dataset described below is a separate tab in the template.
Weekly Flu Admissions
The Weekly Flu Admissions tab shows state-level, weekly data on rates of admission for influenza. By aggregating the data and visualizing the weekly rates over time, you can clearly see the seasonality of the flu. Admissions begin to rise around October, peak in late December/early January, and then decline throughout the remainder of the winter months. 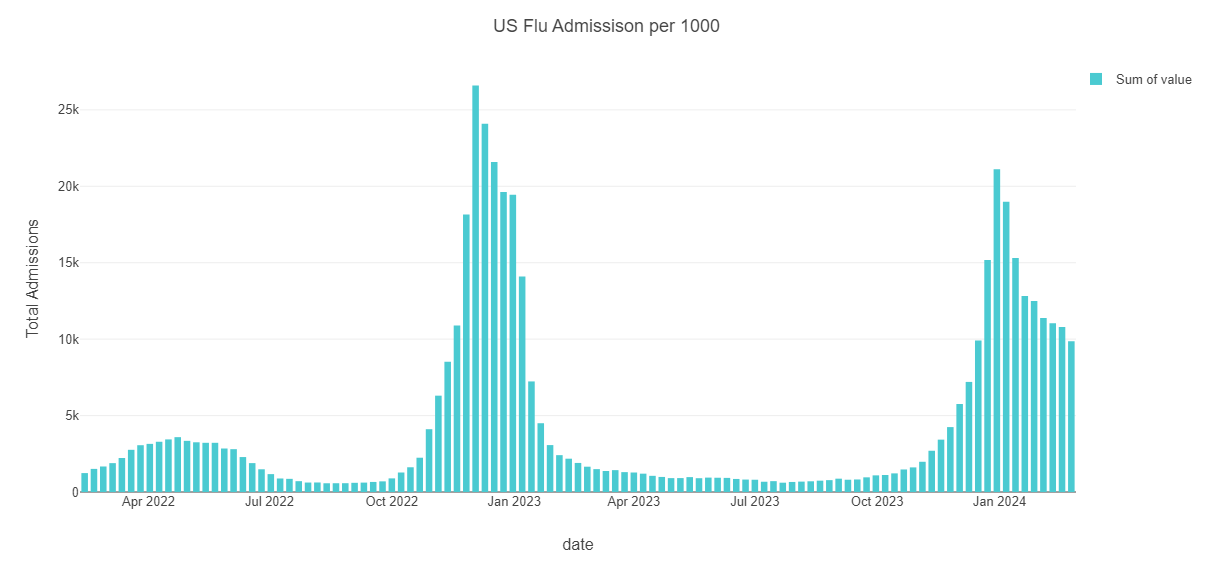
Flu Cases by State
The Flu Cases by State tab shows a pivot table and line graph of weekly flu cases per 1000 people with a few representative states included in the pivot (you can add other states by right-clicking on the pivot table and adding states). In the visualization, you can again see the seasonality of the flu, but also how it varies by state and geographic region. 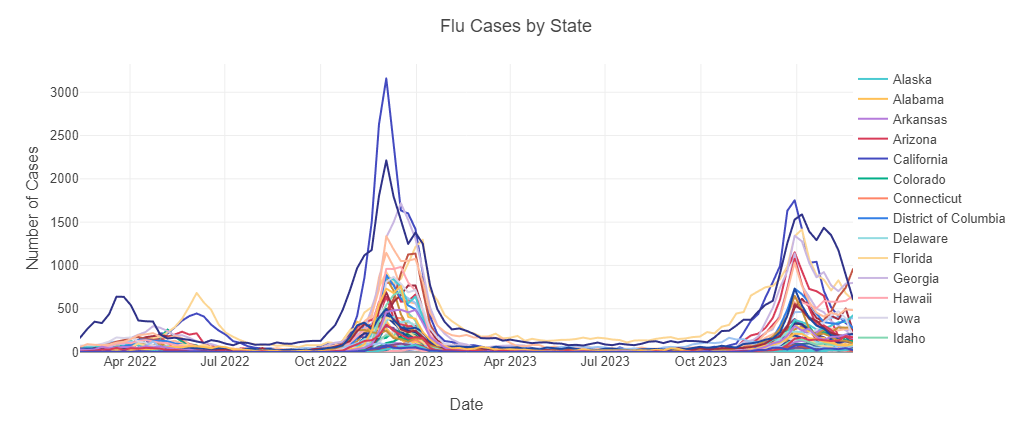
Wastewater Data
The Wastewater Data tab contains a dataset pulled from the NWSS Public SARS-CoV-2 Wastewater Metric Data dataset. The dataset contains county-level sampling data points related to SARS-CoV 2 virus levels present in wastewater. Wastewater can be tested to detect trace levels of infectious diseases circulating in a community, even if people aren’t experiencing symptoms. This can be used as an early warning sign that levels of infections may be increasing or decreasing in a given community.
Respiratory Virus Response
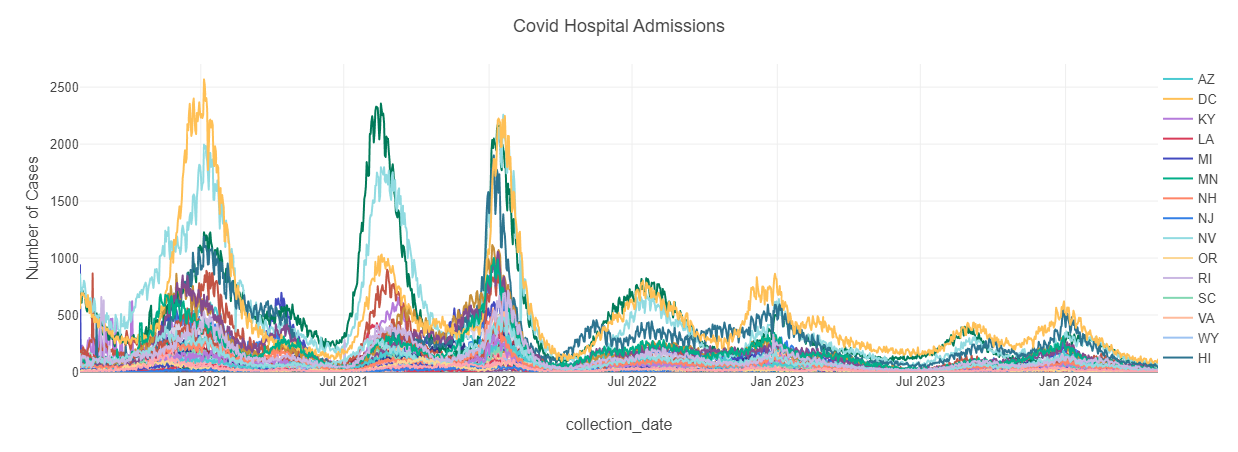
The Weekly Respiratory Virus Response tab contains a dataset representing aggregated hospitalization statistics and metrics related to hospital admissions, Inpatient, and ICU bed capacity, as well as specific metrics tied to respiratory virus, including COVID-19. The dataset contains nearly 4 years of daily admission and capacity data related to respiratory virus response. From this dataset, it is easy to create tables showing the daily US Covid hospital admissions and the state level Covid hospital admissions. Both graphs can be found below or you can open the spreadsheet and filter the data down to only your state. 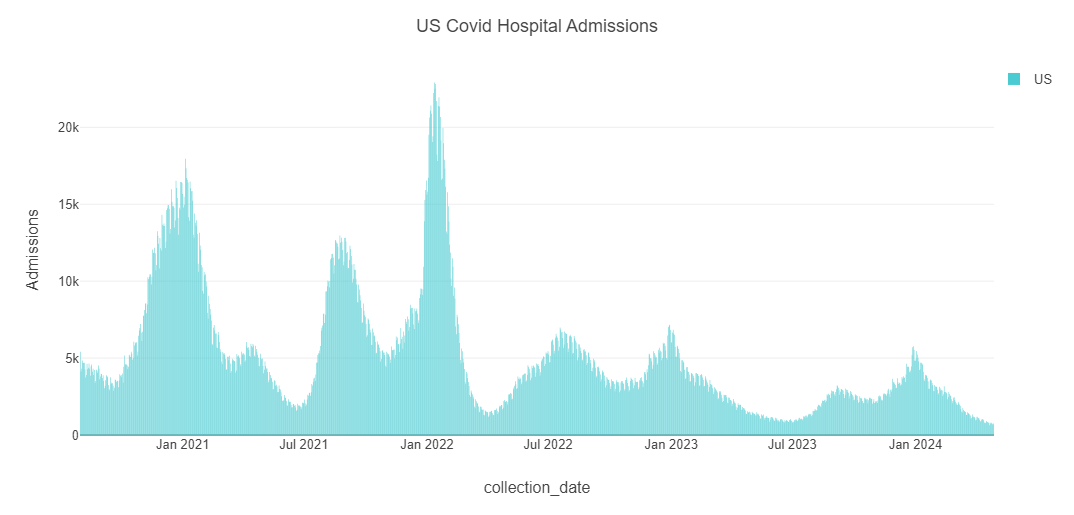
Connecting to CDC Data via API
The template spreadsheet contains Python code (use the 'code' tab in the upper right) that can be easily edited and used to connect to CDC Data API endpoints once you have a data.cdc.gov account and access token. The high-level steps to connect to data.cdc.gov API endpoints are as follows:
- Create a data.cdc.gov account and AccessToken
- Find the dataset identifier of the dataset you want to explore
- Connect to the dataset in a Row Zero Workbook
Below are the detailed steps for each that you can follow:
Create a data.cdc.gov Account and AccessToken
- Visit https://data.cdc.gov/
- Click “Sign In” in the top right of the screen
- Click “Sign in with Tyler Data & Insights ID”
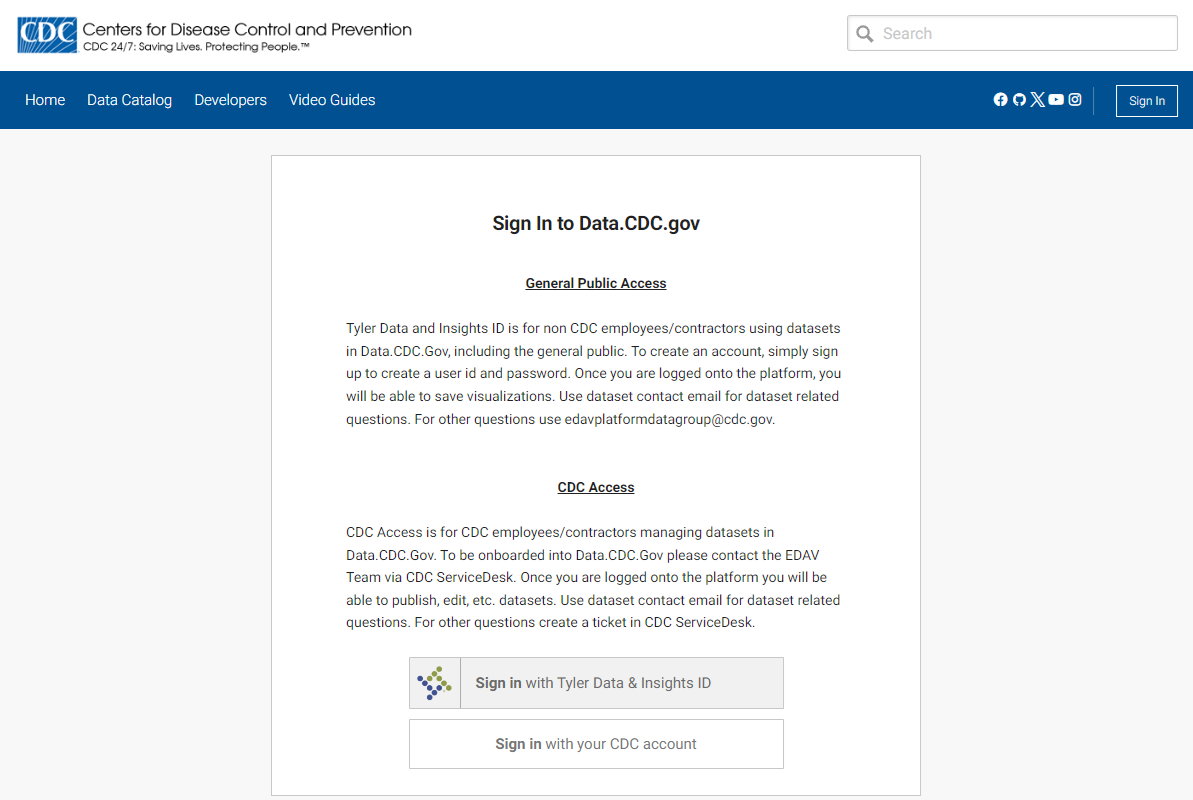
- Go through the sign in process and note your username (your email address) and password. You’ll need to enter both in your Row Zero workbook.
Obtain an Access Token
You’ll also need an AccessToken to avoid having your API connection to data.cdc.gov severely throttled.
Complete the following steps to obtain an AccessToken
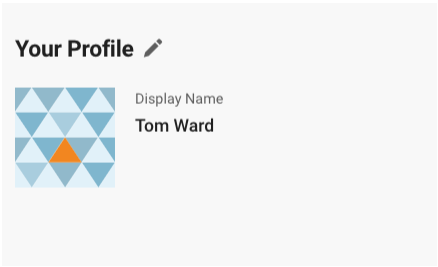
- Log in to your data.cdc.gov account
- Click on your name in the top right of the screen to access your profile
- Click on the pencil icon to edit your profile
- Click on Developer Settings
- Click on the Create New AppToken button and fill out the form (you’ll just need a name and description).
- Note your App Token, you’ll need it to connect your Row Zero template to data.cdc.gov.
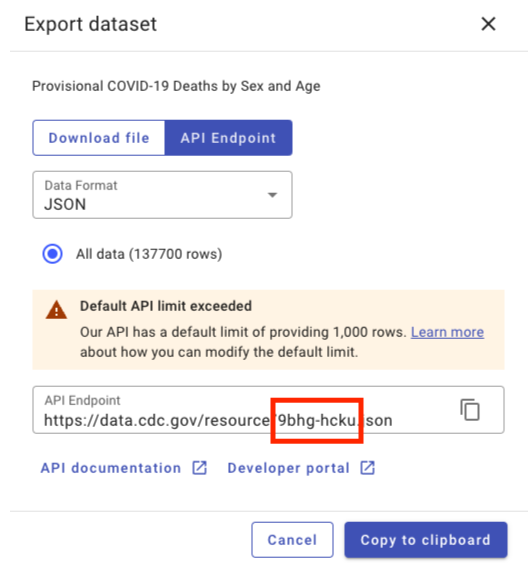
Find a Dataset Data Identifier
- Log in to your data.cdc.gov account
- Click on Data Catalog
- Select a dataset
- Click on API in the Actions menu in the top right of the screen
- Note the string of characters in the API Endpoint field. This is the dataset identifier. You can also find the dataset identifier by viewing the API documentation for the dataset.
Connect to the CDC Dataset in a Row Zero Workbook
- Click here to create a Row Zero template.
- Click the “code” window to view the editable Python code. The code in the template is ready to connect to the data.cdc.gov APIs, you just need to enter your username, password, and the dataset identifier of the dataset you want to connect to.
- Enter your username, password, and dataset identifier and click Run.
- To view the data in the spreadsheet, click on a cell and type “=results”.
Handling Large Datasets Using the CDC API
If you are using some of the very large data sets on the CDC data site, like the COVID-19 Case Surveillance Public Use Data data set, which has 106 million rows, you might want to consider using the $limit and $offset parameters to incrementally load data from the API using a “paging” method as described in this post. Without those parameters, pulling this large data set from the API can be quite slow.
Conclusion
Once you have the API connected and pulling in data, you can access any of the 1200+ data.cdc.gov public datasets and pull data into your Row Zero workbook. Row Zero workbooks give you the advantages of working with big datasets and connecting to data via an API with real-time updates, while still allowing you to use a familiar, spreadsheet UI. For a quick start, open our CDC Data Workbook and analyze the CDC data any way you'd like.