Calculate percent change (% change)
Calculate percent change by taking your new value minus the old value. Take that number and divide by the old value then mulitple by 100 to get your percentage change. The mathematical formula looks like this: (new value - old value)/old value x 100. If the result is a positive percent change then the number increased. If the result was a negative percent change the numbers decreased. This forumla can be used in Excel, Google Sheets, or Row Zero spreadsheets to quickly calculate
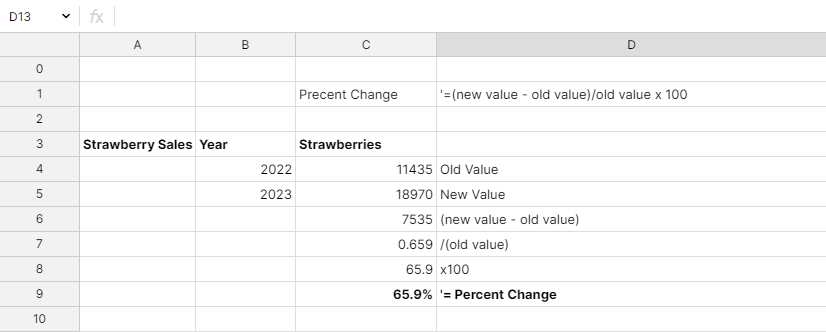
Another way to think about it initial value and final value. Subtract final value - initial value, divide the result by the initial value and multiply by 100 to get the percent change. See an example in the image below.
Take an example of strawberry sales that were 11,435 in 2022 and 18,970 in 2023. The formula for percent change is as follows: (18,970-11,435)/11,435 * 100 = 65.9%
The Percent Change Formula
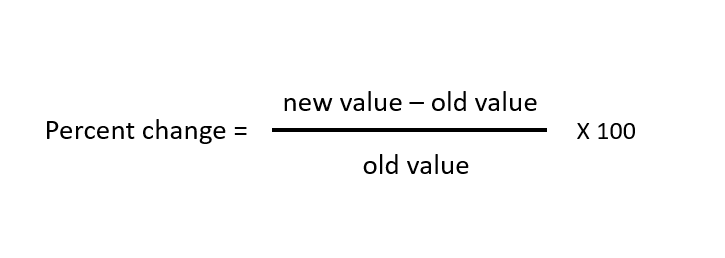
The formula for percent change involves dividing the difference between the final value and the initial value by the initial value. This fraction is then multiplied by 100 to obtain the percentage change. Mathematically, it can be expressed as:
(Final Value - Initial Value) / Initial Value * 100
Let's break down the formula further to understand each component:
- Final Value: This refers to the value at the end of the period or the latest measurement.
- Initial Value: This represents the value at the beginning of the period or the initial measurement.
By subtracting the initial value from the final value, we obtain the difference between the two. Dividing this difference by the initial value gives us a fraction that represents the relative change. Multiplying this fraction by 100 converts it into a percentage.
Examples of Percent Change Calculations
Percent Change Increase - US GDP
US GDP in 2021 was $23.32 trillion and in 2022 was $25.46 trillion. The formula for percent change is as follows: (25.46 - 23.32)/23.32 * 100 = 9.2% US GDP increased by 9.2% from 2021 to 2022 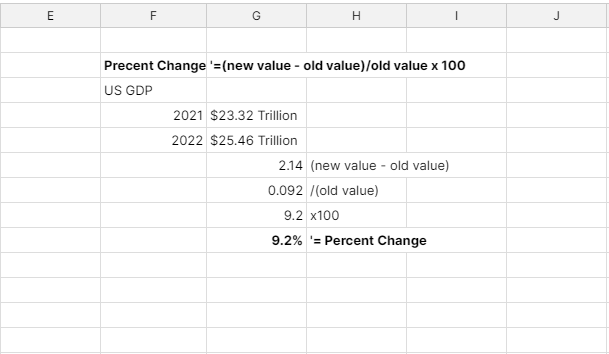
Percent Change Decrease - US Ave Gas Prices
US average gas price in 2022 was $3.95/gallon and in 2023 was $3.52/gallon. The formula for precent change is as follows: (3.52-3.95)/3.95 * 100 = -10.9% US average gas price decreased by 10.9% from 2022 to 2023 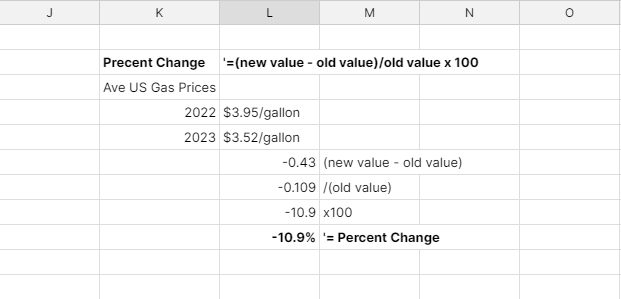
What does percent change represent?
In simple terms, percent change quantifies the relative difference between two values. It is a measure used to express the increase or decrease in a quantity as a percentage of its original value.
Imagine you have a small business that sells handmade candles. Last month, you sold 100 candles, but this month, you sold 150 candles. To calculate the percent change in sales, you would subtract the original value (100) from the new value (150), which gives you 50. Then, you divide this difference by the original value (100) and multiply by 100 to express it as a percentage. In this case, the percent change in sales would be 50%.
Definition of Percent Change
Before we delve deeper into the mechanics of calculating percent change, it is crucial to have a clear definition. Percent change is a numerical representation of the relative increase or decrease between two values. It is expressed as a percentage.
Percent change can be positive or negative, depending on whether the value has increased or decreased. A positive percent change indicates an increase, while a negative percent change represents a decrease. By calculating percent change, we can easily compare the magnitude of change between different values.
Applying Precent Change to the Real World
Why should we bother with percent change? Well, this mathematical concept holds immense value in many real-world scenarios. By understanding percent change, you can assess trends, make informed decisions, and monitor progress.
For example, businesses often use percent change to analyze their sales performance. By comparing sales data from different time periods, they can identify whether their sales have increased or decreased and by how much. This information helps them evaluate the effectiveness of marketing strategies, adjust pricing strategies, and plan for future growth.
Economists also rely on percent change to analyze economic indicators such as GDP (Gross Domestic Product) and inflation rates. By calculating the percent change in these indicators over time, economists can assess the health of an economy, identify potential risks, and formulate appropriate policies.
Moreover, percent change is useful in everyday life. Let's say you're planning a road trip and want to estimate the increase in fuel expenses due to rising gas prices. By calculating the percent change in gas prices, you can anticipate the impact on your budget and make necessary adjustments.
Whether you're a business owner, economist, or simply curious about the world, calculating percent change empowers you with valuable insights. It allows you to understand the magnitude of change, make comparisons, and make informed decisions based on data-driven analysis.
Basic Mathematical Concepts for Calculating Percent Change
Before we embark on calculating percent change, it's essential to review some fundamental mathematical concepts that come into play when working with percentages.
When calculating percent change, we need to consider two numerical values: the initial value and the final value. The initial value represents the starting point, while the final value corresponds to the end result. Both values are essential to measure the extent of change and calculate the percentage difference.
Let's take an example to understand this concept better. Suppose you have a business that made $10,000 in sales last month (the initial value) and $15,000 in sales this month (the final value). To calculate the percent change, we need to find the difference between the final value and the initial value, which in this case is $15,000 - $10,000 = $5,000. Then, we divide this difference by the initial value ($5,000 / $10,000) and multiply by 100 to express it as a percentage. In this example, the percent change is 50%.
Another important aspect to consider when working with percentages is the representation of percentages as fractions or decimals. Fractions represent ratios, while decimals simplify the expression of ratios into more convenient numerical representations.
Let's continue with our example to illustrate this concept. The percent change we calculated earlier, 50%, can also be expressed as a fraction, 1/2, or as a decimal, 0.5. These different representations allow us to interpret the percent change in various ways. For instance, the fraction 1/2 can be interpreted as "half" or "50 out of 100." Similarly, the decimal 0.5 can be understood as "0.5 out of 1" or "50% of the initial value."
Understanding the relationship between fractions and decimals is crucial for accurate calculations and precise interpretations of percent change. It enables us to communicate the extent of change in different formats, depending on the context and the audience.
Interpreting the Results of the Formula
The result obtained from the percent change formula represents the percentage difference between the initial and final values. A positive value indicates an increase, while a negative value denotes a decrease. The magnitude of the percentage change indicates the relative extent of the difference.
For example, if the percent change is 10%, it means that the final value is 10% greater than the initial value. Conversely, if the percent change is -10%, it indicates that the final value is 10% less than the initial value.
Understanding the results of the percent change formula is crucial for making informed decisions. It allows us to analyze trends, track growth or decline, and evaluate the impact of various factors on a given value.
Now that we have a comprehensive understanding of the percent change formula and its interpretation, let's explore some practical examples and applications of this concept in real-world scenarios.
Step-by-Step Guide to Calculating Percent Change
Now that we have covered the theory behind percent change, let's put it into practice with a step-by-step guide to calculating percent change.
Identifying the Initial and Final Values
The first step in calculating percent change is to identify the initial and final values involved in the calculation. The initial value represents the starting point, while the final value corresponds to the end result. These values may be obtained from historical data, financial records, or any other relevant source.
Applying the Percent Change Formula
Once you have identified the initial and final values, it's time to apply the percent change formula. Replace the variables in the formula with the respective values you have identified.
Calculating the Percent Change
After substituting the values, perform the necessary calculations to obtain the percent change. The resulting figure represents the relative difference between the initial and final values as a percentage.
Common Mistakes to Avoid When Calculating Percent Change
While calculating percent change may seem straightforward, there are some common mistakes to watch out for. By being aware of these pitfalls, you can ensure accurate calculations and reliable interpretations of percent change.
Incorrectly Identifying Initial and Final Values
Mixing up the initial and final values can lead to erroneous percent change calculations. It is essential to double-check and verify which value represents the starting point and which one corresponds to the end result before applying the formula.
Misapplying the Percent Change Formula
A common mistake is misapplying the percent change formula itself. Mathematical errors such as using the wrong signs or failing to perform the calculations correctly can result in inaccurate percent change values. Always double-check your calculations to avoid such mistakes.
Summary
By understanding the concept of percent change and mastering its calculation, you can gain valuable insights into your data. Whether you're tracking financial growth, analyzing trends, or making informed decisions based on data, percent change is an indispensable tool. Armed with this step-by-step guide, you are now equipped to calculate percent change accurately and confidently interpret its results. Try calculating percent error in a Row Zero workbook now.