P-value is a fundamental component in statistical analysis that is used to help conclude which experimental results are caused by the difference between the test and control groups and which results are merely random occurences. To help calculate P-value, we've created a P-value calculator which can be accessed by clicking the link above. In this article, we explore the definition of P-value, its importance in statistical analysis, the details needed when calculating P-value, the steps involved in the calculation process, how to interpret the P-value, and common mistakes to avoid. .
 For further instructions skip to the how to use a P-value calculator section.
- Definition of P-Value
- What is the null hypothesis?
- How to Interpret P-value?
- How to calculate a P-value
- What are left-tailed, right-tailed, and two-tailed tests?
- What are Degrees of Freedom?
- Limitations of P-value
- Sample size, effect size, and power
- How to use a P-value calculator
- Tools and software for calculating p-value
- Steps to calculate P-value
- Common mistakes in calculating p-value
- Conclusion
Definition of P-value
P-value refers to the probability of obtaining test results as extreme as or more extreme than the observed data, assuming no difference between the test and control groups. It is a statistical method to measure how strong the signal from a given data set is when compared to a set of random data. The stronger the difference, the more likely it is that the observed data set is an indication of a real signal.
It is important to note that the P-value does not provide information about the magnitude or practical significance of the observed effect. Instead, it focuses on the statistical significance, helping researchers determine whether the observed results are unlikely to have occurred by chance alone or the experimental difference between the control and test groups in an experiment.
What is the Null Hypothesis?
When conducting statistical tests, researchers often start with a null hypothesis, which represents the absence of an effect or relationship. In other words, the null hypothesis represents the possibility of achieving the same set of results considering the possibility there is no difference between the two test groups in the experiment. The P-value quantifies the likelihood of observing the data if the null hypothesis were true. If the P-value is small, it suggests that the observed data is unlikely to occur under the null hypothesis, indicating strong evidence against it.
For example, consider an experiment where there are two groups of mice that are fed the same amount of food each day. For 30 days, one group is given a small pill that scientists suspect will cause them to grow faster. At the end of 30 days, the mice in both groups are weighed and the group that was given the supplement weighs 25% more than the control group. In this experiment, the null hypothesis is the possibility that neither group was given a pill and the results were simply random variation.
How to Interpret a P-value
The smaller the p-value, the greater the statistical significance of an observed result. A p-value is generally used in a significance test and compared to a threshold value called the alpha level or significance level (I’ll use the term “significance level” in the remainder of this post). If the p-value is less than or equal to the threshold value, then the null hypothesis is rejected. Commonly, 0.05 is used as the significance level, but a researcher or experimenter may choose a different value based on the subject matter or the context of the experiment. If the p-value is less than or equal to the significance level, then you reject the null hypothesis and accept the alternative hypothesis. If the p-value is greater than the significance level, then you accept the null hypothesis and reject the alternative hypothesis.
As an example, let’s say that you are working in quality control at a factory testing that a supply has a consistent weight. The mean weight of the supply is supposed to be 10 lbs. You conduct an experiment in which you randomly sample some of the supply. Your null hypothesis is that the mean weight = 10 lbs and your alternative hypothesis is that the mean weight is less than or greater than 10 lbs. In your experiment, You decide to use a significance level of 0.05 and your experiment results in a p-value of 0.02. Since 0.02 <= 0.05, you would reject the null hypothesis of a mean = 10lbs. And accept the alternative hypothesis that the mean weight is less than or greater than 10 lbs.
The scientific community generally uses .05 as the threshold for statistical significance but in some cases even smaller numbers are used. A P-value of .05 means there is only a 5% chance the same results would be achieved with a data set of random inputs. In other words, there is 95% confidence that the results of the experiment are real. While 95% may seem like a certainty, it also means if you were to run the experiment 20 times, you would achieve a statistically significant result 1 time.
How to Calculate a P-value
P-values are calculated by inputting a test statistic into the cumulative density function of a probability distribution appropriate for the test statistic under the null hypothesis. Cumulative density functions can be rather complicated for some probability distributions and that’s why it’s handy to have a calculator or table.
What are Left-tailed, Right-tailed, and Two-tailed Tests?
To calculate a p-value, you also need to determine the “tailedness” of your test, which depends on what your alternative hypothesis is. If your alternative hypothesis is that the data produce a value equal to or less than the observed test statistic, then you would use a left-tailed test. If your alternative hypothesis is that the data produces a value equal to or greater than the observed test statistic, then you would use a right-tailed test. A two-tailed test would be appropriate if your alternative hypothesis is that the data produces a value either less than or greater than the observed test statistic.
What are Degrees of Freedom?
In addition to the test statistic, some distributions also require degrees of freedom as input. Degrees of freedom refers to the number of values in the final calculation of a statistic that are free to vary. If you expect one variable to change (e.g. weight in the example of mice), then you have 1 degree of freedom. If you expect 2 variables (e.g. height and weight in the example of mice), then you have 2 degrees of freedom.
Limitations of P-value
P-values are often misinterpreted and relied on too heavily to support the statistical significance of a result. P-values can provide valuable information, but need to be used along with other supporting evidence. You should not assume that a p-value under an arbitrary significance level like 0.05 means that an alternative hypothesis can be accepted without other supporting evidence.
In recent years, the American Statistical Association (ASA) has issued several statements on p-values, originally stating widespread agreement that p-values are often misused or misinterpreted. However, the latest of these statements walked this back a bit by stressing that "p-values and significance tests, when properly applied and interpreted, increase the rigor of the conclusions drawn from data."
Sample Size, Effect Size, and Power
Factors such as sample size, effect size, and study power can influence the P-value, and researchers should consider these factors when interpreting the results. Sample size is the number of measurements, values, or participants in each test group. Generally the greater the sample size (e.g. number of mice) the better because it makes it easier to detect statistically significant changes between the test groups. Effect size also plays a role in calculating statistical significance. If the difference between the test group and the control group is large, statistical significance can be measured with fewer samples whereas a small difference will require a much larger sample size to become statistically significant. In the example of mice above, this could be the difference between a 5% increase in weight vs a 50% increase in weight.
How to use a P-Value Calculator
Open the p-value calculator - This p-value calculator is a Row Zero template and once you open it, it is your personal version. You can save, store, and edit the file in any manner that meets your needs.
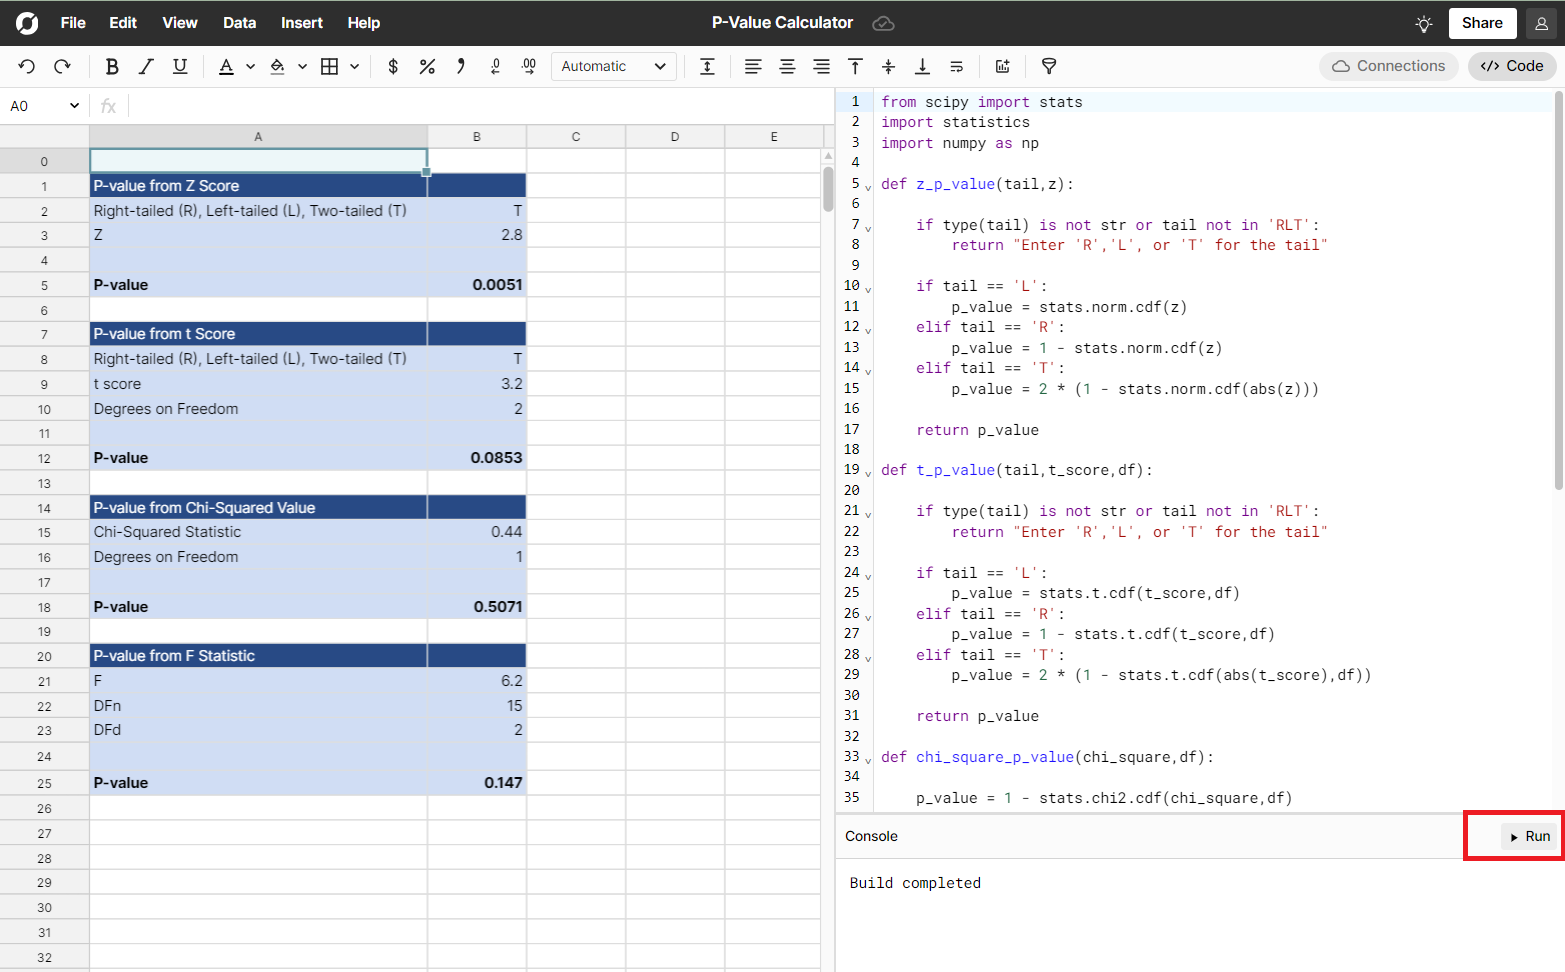
Once you have your own copy, click “Run” in the code window.
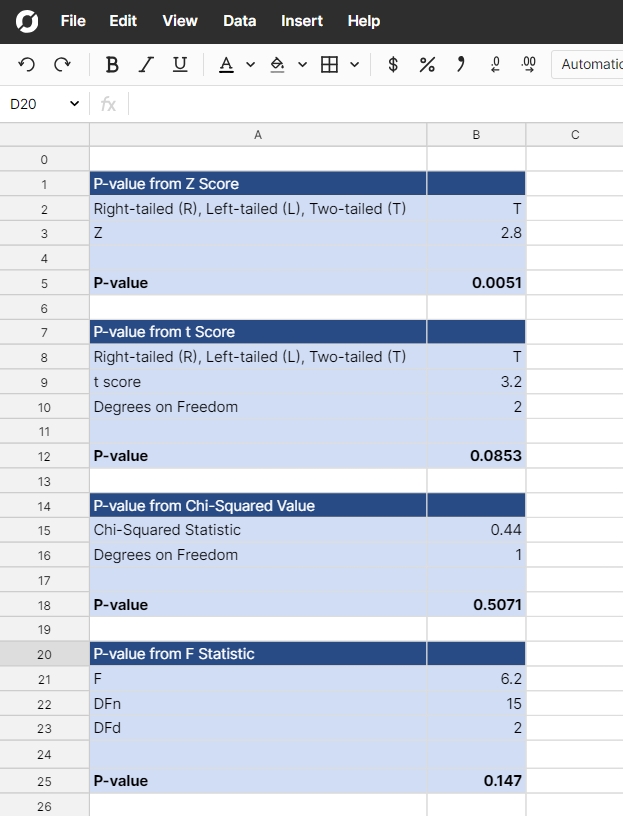
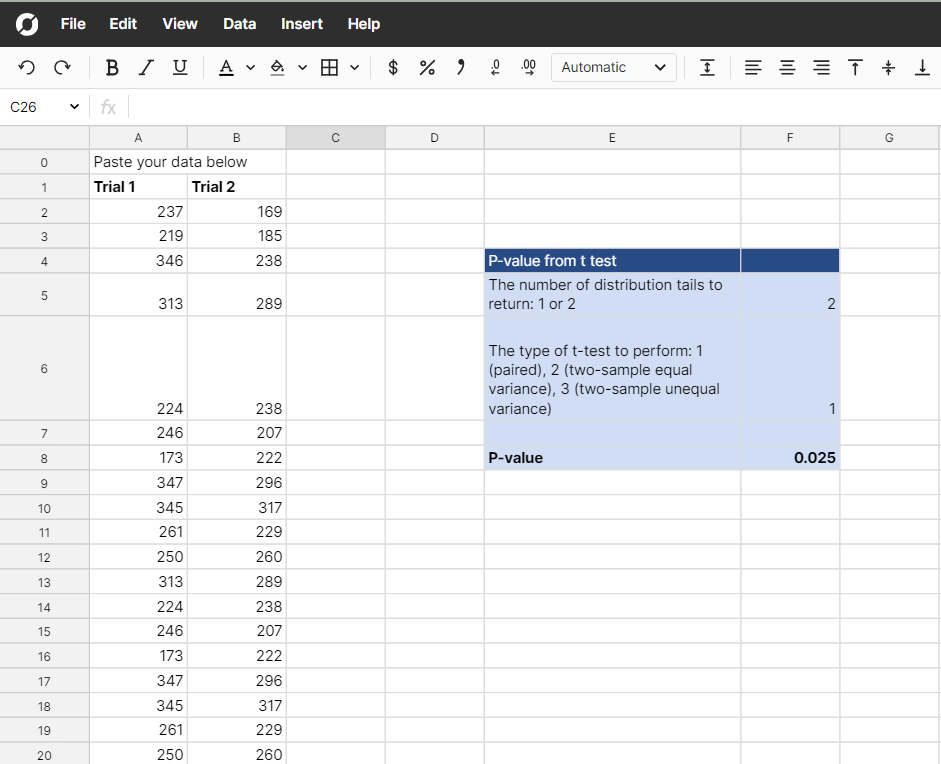
In the p-value calculator, There are also separate tabs that allow you to input your summary statistics or paste in raw data to perform a T test or F test and calculate a p-value from the generated test statistic.
To use the summary statistic calculator, simply find the test statistic or score appropriate for your distribution and enter the necessary inputs. Your resultant p-value will be calculated in the cell labeled p-value. To use the raw data calculator, paste your data in the appropriate columns to get your p-value.
The calculator uses Scipy, a powerful Python statistics library. The stats module of Scipy contains a lot of useful methods for calculating the p-value of various distributions. One powerful aspect of Row Zero is that it allows you to make use of the vast Python data ecosystem, including libraries like scipy, while doing most of your work in a familiar spreadsheet environment. If you are familiar with Python, you can use these functions as a guide to creating additional p-value functions for other probability distributions using the scipy documentation for the stats module.
Tools and Software for Calculating P-Value
In addition to statistical knowledge, using appropriate tools and software is necessary for calculating P-value. Spreadsheets like the Row Zero one provided here make calculating p-value easy. There are also other statistical packages, such as R or SPSS, or Python packages can help streamline the process and generate accurate results. But P value can also be calculated in spreadsheets or online calculator tools. Familiarize yourself with these resources to ensure efficient P-value calculations.
R
R is a widely used programming language and software environment for statistical computing and graphics. It provides a vast array of functions and packages specifically designed for hypothesis testing and P-value calculation. Learning how to use R for P-value calculations will enable you to perform complex statistical analyses with ease.
SPSS
SPSS (Statistical Package for the Social Sciences) is another popular software tool used for statistical analysis. It offers a user-friendly interface and a wide range of features for data manipulation, hypothesis testing, and P-value calculation. Mastering SPSS will allow you to conduct rigorous statistical analyses and obtain accurate P-values.
Python
Python has become the most popular tool for data analysis and open source libraries exist that make it easy to calculate P-value. We use some statistical python packages in our p-value calculator.
Spreadsheets
Spreadsheets like Excel, Google Sheets, and Row Zero can also help calculate P-value. When using spreadsheets and pasting raw data into the sheet to calculate p-value, Google sheets and Excel both have row limits that may prevent some of the data from being imported or cause the workbook to crash.
It is important to note that while software can assist in P-value calculation, a solid understanding of the underlying statistical concepts is still necessary. The software is a tool that helps automate the calculations, but it is the user's responsibility to interpret and apply the results correctly.
Steps to Calculate P-value
Formulating a Hypothesis
Before conducting any experiments or analyzing data, it is vital to formulate a clear hypothesis. The hypothesis should state the null and alternative hypotheses and define the specific question being investigated. A well-defined hypothesis provides a solid basis for calculating the P-value.
Formulating a hypothesis is a crucial step in the scientific method. It allows researchers to make predictions and test their theories. When formulating a hypothesis, it is important to consider previous research and existing knowledge in the field. This ensures that the hypothesis is grounded in scientific understanding and can be tested effectively.
Once a hypothesis is formulated, it serves as a guide for the entire research process. It helps researchers focus their efforts, determine the appropriate data to collect, and choose the statistical tests to apply. Without a clear hypothesis, the calculation of the P-value becomes meaningless, as there is no specific question to answer.
Conducting the Experiment
Once the hypothesis is formulated, the next step is to conduct the experiment or gather data relevant to the research question. Ensure that the experiment is designed carefully, considering factors like sample size and control groups, to generate reliable results.
Conducting an experiment involves carefully planning and executing a series of steps to collect data. This may include selecting participants or subjects, defining variables, and determining the appropriate methodology. It is important to ensure that the experiment is conducted in a controlled environment to minimize external influences that could affect the results.
During the experiment, researchers must adhere to ethical guidelines and ensure the safety and well-being of the participants. They must also record data accurately and consistently to maintain the integrity of the results. By conducting the experiment with precision and attention to detail, researchers can increase the reliability of their findings and ultimately calculate a more accurate P-value.
Collecting and Analyzing Data
After data collection, thorough analysis is required to calculate the P-value accurately. This involves applying appropriate statistical tests, such as t-tests or chi-square tests, depending on the nature of the data. The calculated test statistic is then used to determine the P-value.
Collecting data is a critical step in the research process. It involves systematically gathering information that is relevant to the research question. This can be done through various methods, such as surveys, observations, or experiments. The data collected should be representative of the population or sample being studied, ensuring that it provides meaningful insights.
Once the data is collected, it needs to be analyzed to draw meaningful conclusions. Statistical analysis allows researchers to identify patterns, relationships, and trends within the data. This analysis involves applying mathematical formulas and statistical tests to determine the significance of the findings. By analyzing the data thoroughly, researchers can calculate the P-value accurately and draw valid conclusions from their research.
Common Mistakes in Calculating P-value
Misinterpretation of Results
One common mistake researchers make is misinterpreting the P-value. It is essential to view the P-value as a continuous measure of evidence, rather than a strict threshold for significance. Researchers should consider other factors, such as effect size and study design, when drawing conclusions from the P-value. Statistical significance does not necessarily imply practical significance, and researchers should carefully consider the magnitude and real-world implications of their findings.
P-Value Thresholds
It is often tempting to use a slightly larger p-value than .05 to conclude statistical significance. Suppose you spend months running an experiment and the p-value is calculated as .071. The value is close to being significant so why not simply say it's good enough? There is an on-going debate about the ramification of sliding scales for p-value and it's a slippery slope. Without strong adherence to a standard claiming significant experimental results it becomes harder to know what results are real or random. At some tech companies, there are entire groups dedicated to enforcing proper experimental rigor for this exact problem. Moreover, the P-value allows researchers to compare the results of different studies and assess the reproducibility of findings. If multiple studies yield similar P-values, it provides confidence in the robustness and generalizability of the observed effects.
Errors in Data Collection
Another frequent error is related to the quality of data collected. Inaccurate or biased data can lead to unreliable P-value calculations. Researchers must adhere to rigorous data collection protocols, ensuring proper randomization, minimizing confounding variables, and reducing measurement errors.
By following these steps and avoiding common mistakes, researchers can calculate the P-value accurately and make informed decisions based on their statistical analysis.
Conclusion
In conclusion, understanding the concept and calculation of P-value is essential for conducting robust statistical analyses. Accurate interpretation of P-values helps researchers distinguish between random fluctuations and significant results, guiding informed scientific conclusions. Tools like Python and spreadsheets, especially the powerful cloud-based Row Zero, are invaluable in simplifying these calculations, allowing users to efficiently process large datasets and conduct complex statistical analyses with greater ease and accuracy. This integration of technology into statistical practices not only enhances the accuracy of research but also democratizes access to advanced data analysis techniques.