Creating a graph
Click anywhere inside the data set you wish to graph and then click on the graph button. Once the graph button is clicked, the graphing window will be accessible from the right menu bar. Clicking out of the graph will close the graph window and a click back into the graph will re-open it. 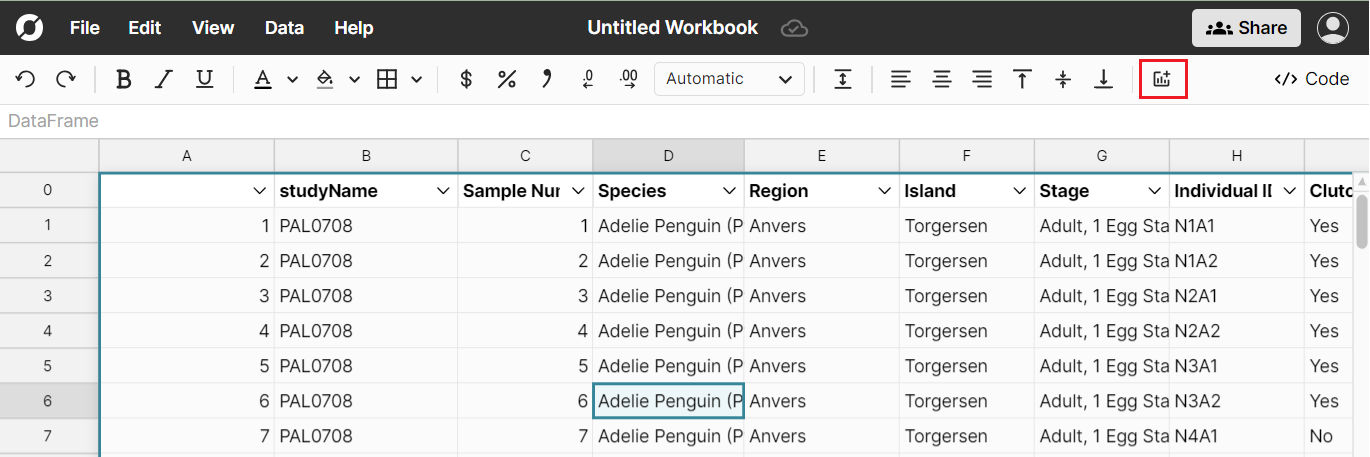
The graph window will expand from the right side of the screen and automatically plot data based the range selected. If only one column was selected, a histogram of the data in that column will be created. If two or more columns of data are selected a graph of all the data sets will be created. If no data was selected, the series can be selected from the graph window 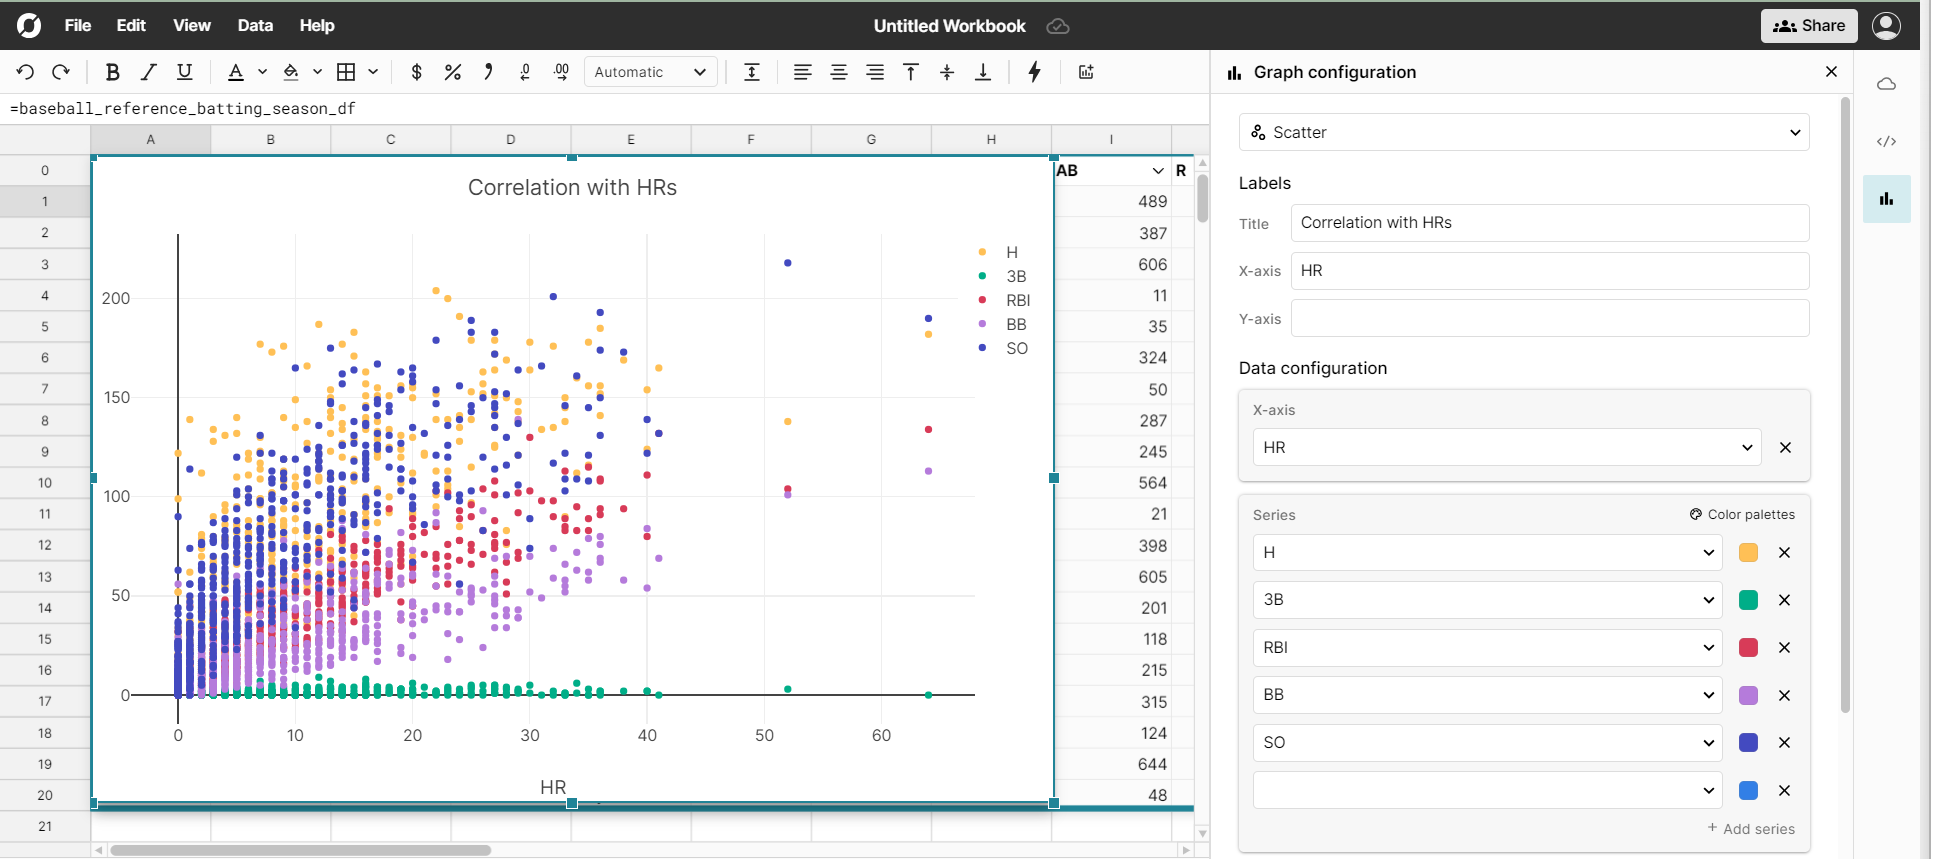
Graph window
Once the initial graph is created, the graph window can be used to do the following:
- Add/remove series
- Change the graph type
- Change the title
- Add multiple axis
- Apply labels
- Select color pallets
- Select series colors
- Flip rows/columns
- Change point style
Move a graph
Graphs can be moved by clicking and dragging around the screen.