Connect Postgres to a Row Zero Spreadsheet
The following post provoides a brief overview of the benefits and challenges of analyzing data stored in a Postgres database and provides simple instructions for connecting Row Zero to a Postgres database to import and analyze data. For the fastest path, go to Row Zero to connect your PostgreSQL database now.
Contents: (go straight to connection steps)
- What is PostgreSQL?
- Why is it helpful to analyze data from a PostgreSQL database in a spreadsheet?
- Why is it hard to analyze data stored in a PostgreSQL database with a spreadsheet
- How to pull PostgreSQL data into a Spreadsheet
- Overview
What is PostgreSQL?
PostgreSQL, often referred to simply as 'Postgres' is an open source object-relational database management system (ORDBMS). It was developed at the University of California Berkely in 1986. PostgreSQL is popular because it is open source (free) and runs on all major operating systems, including Linux, Unix, Mac OS, and Windows. It also supports text, image, sound, and video files. Lastly, it has programming interfaces for many of the more popular languages, like C/C++, Java Perl, Python, Ruby, and others. You can find all the details about PostgreSQL at postgresql.org.
Why is it helpful to analyze data from a Postgres database in a spreadsheet?
Data stored in a Postgres database is often only accessible to analytics and BI people who know how to write SQL or work with BI tools. Business, finance, marketing, and operations people are usually most comfortable in spreadsheets but are often relegated to using rigid dashboards or making requests of BI teams in order to answer their questions.
With Row Zero, anyone can connect directly to a company's Postgres instance, import data into the spreadsheet and perform the analysis they need. The connection can be facilitated by an analytics or BI team and then shared with business partners or credetials given directly to business teams to connect their own accounts. Row Zero is enabling true self-serve analytics. Below are some example use cases:
- Live models - Build a model around a live data set. Instead of recreating that model on a weekly or monthly cadence, simply refresh the data import from the database and the Row Zero workbook updates every value.
- No SQL needed - Enable business, operations, supply chain and marketing teams to access and analyze big data sets in a Postgres database without having to learn new tools or make requests of their BI team.
- Explore and visualize - Analyze data by both viewing the individual rows, graphing, and pivoting the data. Drill down into the actual values to understand where anomalies exist.
- Ad-hoc analysis - Spur of the moment questions provoked by dashboards can be quickly answered with simple spreadsheet analysis without going back to the BI team.
- Collaborative decision making - Mulit-user collaboration makes decision-making easier when every business partner has access to the gold data set and can share the analysis in a spreadsheet format others can easily audit and inspect.
- Join data sets - Often times an analysis requires joining two distinct data sets that may not reside in the same database. Row Zero lets users connect any number of data sources and upload csvs. Join the data sets with join statements, VLOOKUP/XLOOKUP, or Python CONCAT or UNION functions.
Why is it hard to analyze data stored in a PostgreSQL database with a spreadsheet?
Postgres databases make it easy and cheap to store, organize, and and access large amounts of data, but it can be challenging to analyze data stored in Postgres database with a spreadsheet for 2 main reasons:
1. Dataset Size
Analyzing and processing large amounts of data is not easy. Microsoft Excel and Google Sheets slow down or crash when big data sets are imported. See blogs Excel Row Limit and Google Sheets Row Limit for more information. Row Zero is a spreadsheet designed for big data that can process hundreds of millions of rows of data.
Due to the performance deficiencies of legacy spreadsheets, companies typically resort to paying for expensive BI and dashboard tools, like Looker, Tableau, and Power BI when their data sets grow beyond what normal spreadsheets can handle. These more advanced tools require a data engineer to set-up and require business users to learn new skills. Analysis performed in BI tools are constrained to pivot table style aggregations and filters whereas a powerful spreadsheet, like Row Zero, gives every department the ability to work with big data and build financial models, create supply/demand forecasts, and perform marketing list cleaning and enrichment, among other projects.
2. The need to know SQL
If a company stores data in a PostgreSQL database, employees must use a SQL editor to write queries in order to access and analyze data. Many business analysts do not know SQL, often creating a queue of requests from finance, operations, supply chain, and marketing teams to their BI counterparts. Businesses often try to mitigate this problem by using BI and dashboard tools.
While these tools are nice for high level metrics and claim to provide self-serve analytics, they are not actually useful for everyone. Business users consistently express the desire to export data from data sources to spreadsheets to perform their own analysis and build models. Row Zero operates on the same spreadsheet skills business analysts already have and is instantly usable by everyone in a company. Simply connect to the database and write a simple query, like 'select * from TABLENAME' and all the data is instantly pulled into a spreadsheet where business analysts get easily work with it.
How to pull data from a Postgres databse into a Spreadsheet
There are 3 steps to easily connect a Postgres database to Row Zero and analyze data in the spreadsheet. Follow the instructions below to get started.
- Connect Row Zero to your PostgreSQL database
- Write a query to import data
- Begin analysis in Row Zero
1. Connect Row Zero to a Postgres database
In Row Zero click on the 'data source' icon in the right-hand menu and then click the button for 'New data source.' 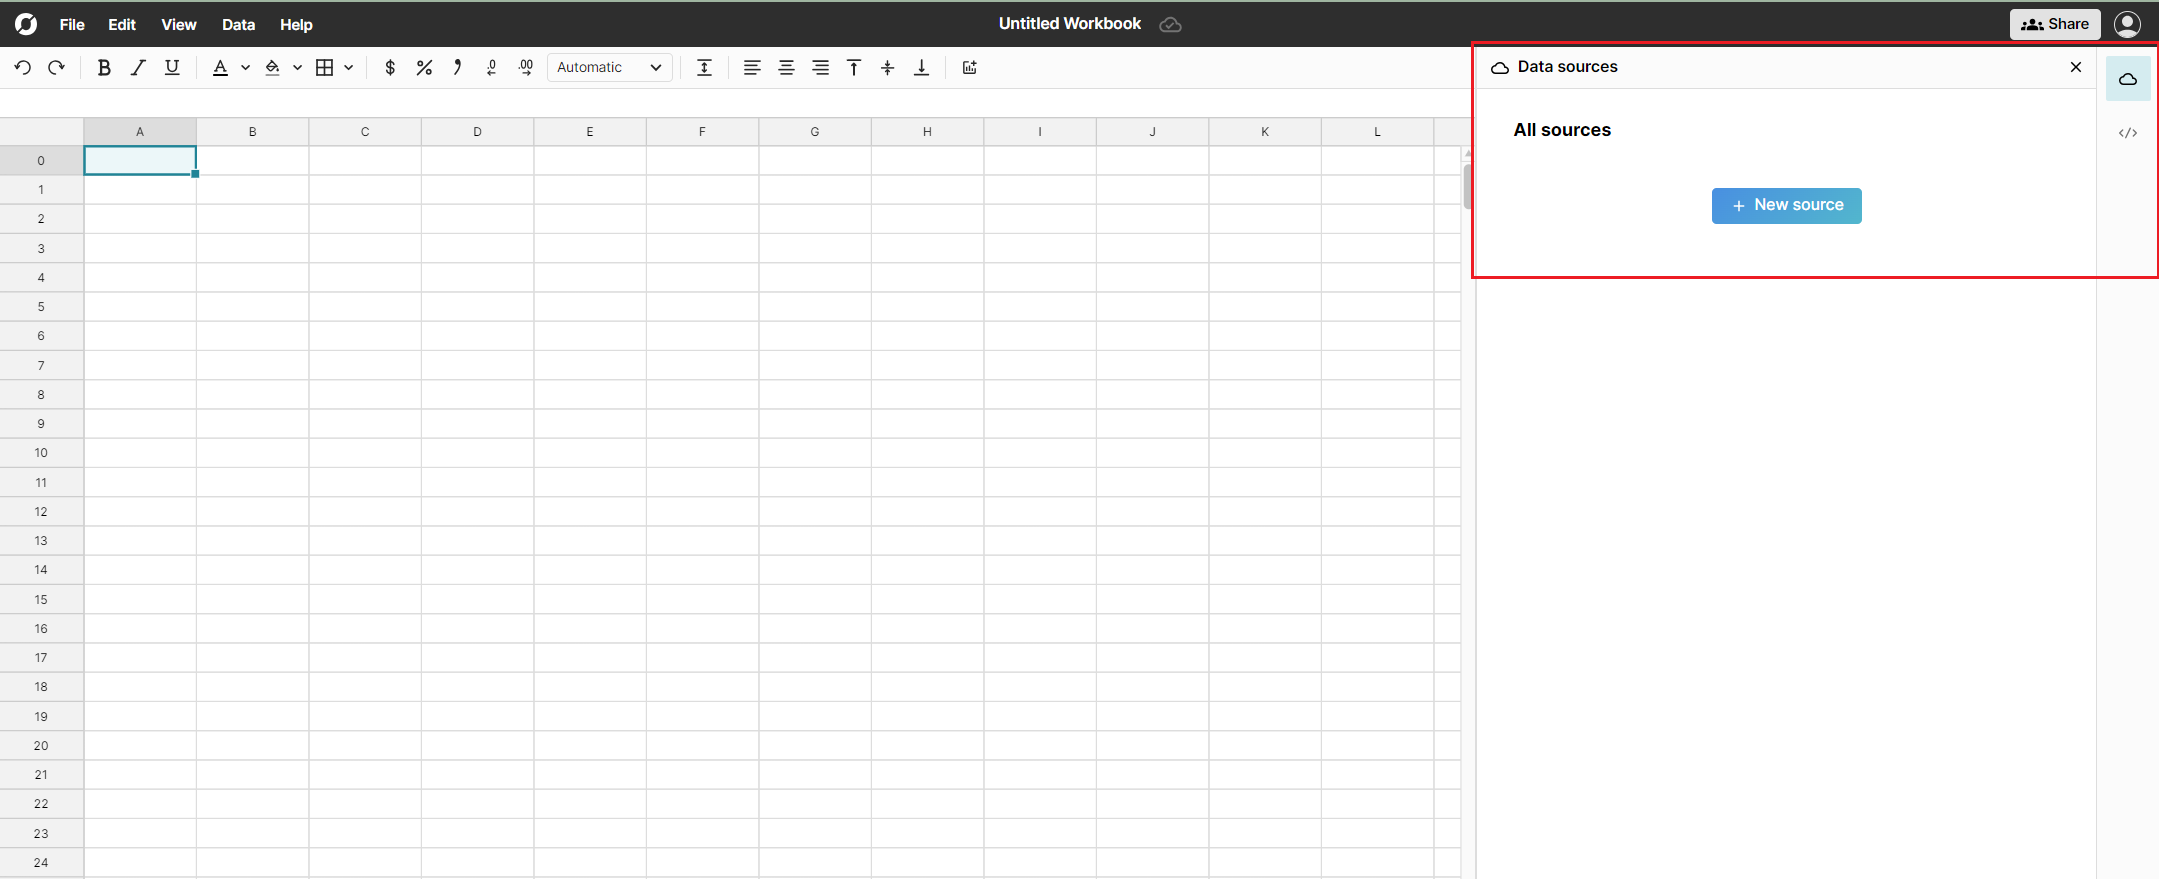
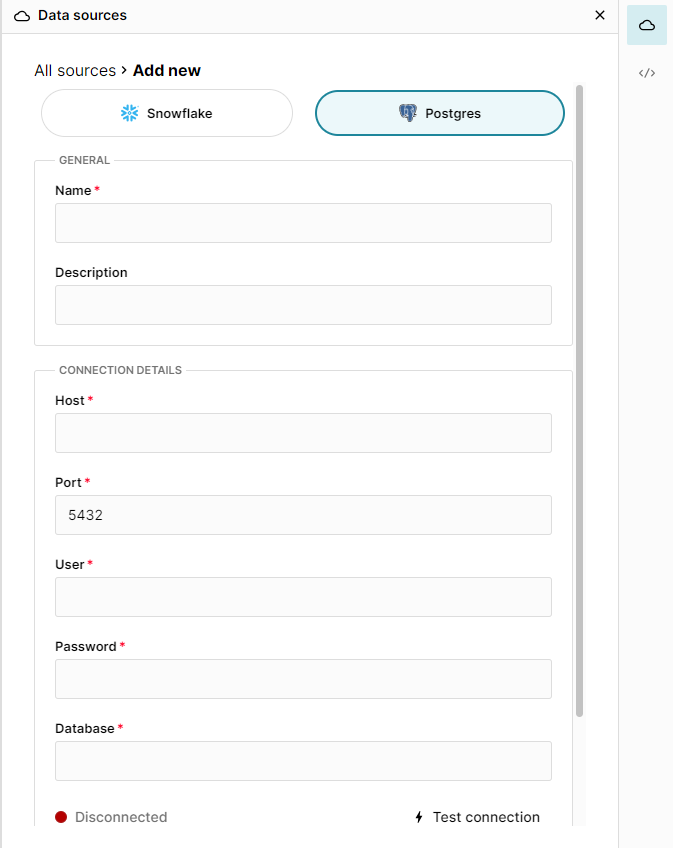
The connection requires 6 pieces of information defined below.
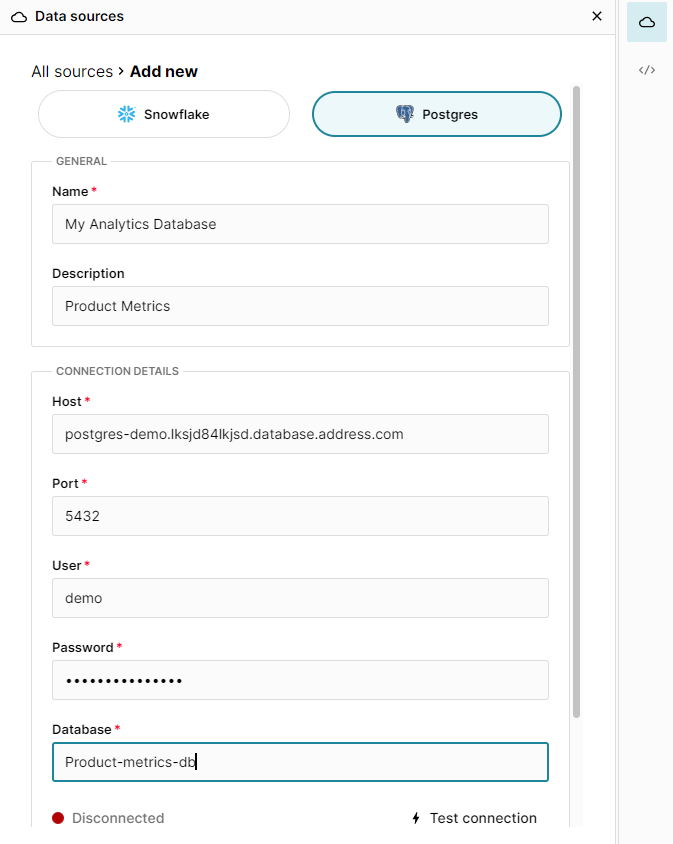
- Name - This field can be anything that helps identify the data source being connected. (e.g. "Production Data" or "Product Metrics")
- Host - This is the PostgreSQL address that typically takes the form of a string like 'database.mydomain.com.'
- Port - This is often 5432.
- User - This is the username for your PostgreSQL database.
- Password - The password used to log into your PostgreSQL database.
- Database - The name of the PostgreSQL database being connected to.
Once all the information is entered, hit 'Test connection' to ensure the information is correct. If the test connection icon turns green and says 'Connected', proceed by clicking on '+ Add Source.' 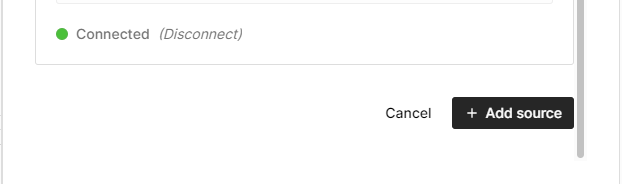
2. Write a query to import data
Now that the Postgres database is connected to Row Zero, begin writing a query to pull data into the spreadsheet. First select the 'Schema' from the drop down. Write a query in the query editor. The easiest query to write is the 'select *' statement, which pulls in the entire table. Example:
select * from TABLENAME
Row Zero is equipped to handle large data sets and will easily ingest the entirety of a database. Once the query is executed by hitting the 'run' button at the bottom of the SQL window, Row Zero will show the progress of the data import. You can see the amount of time it has taken and the number of rows imported. 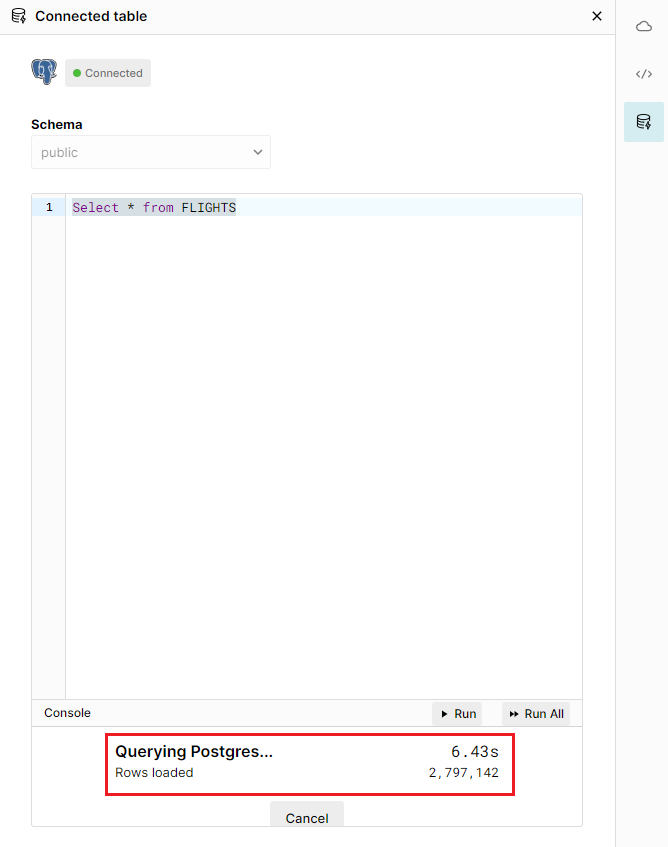
Write more complicated queries to pull in various subsets of data stored in the Postgres database. All results will be displayed in the 'connected data table' in the spreadsheet. 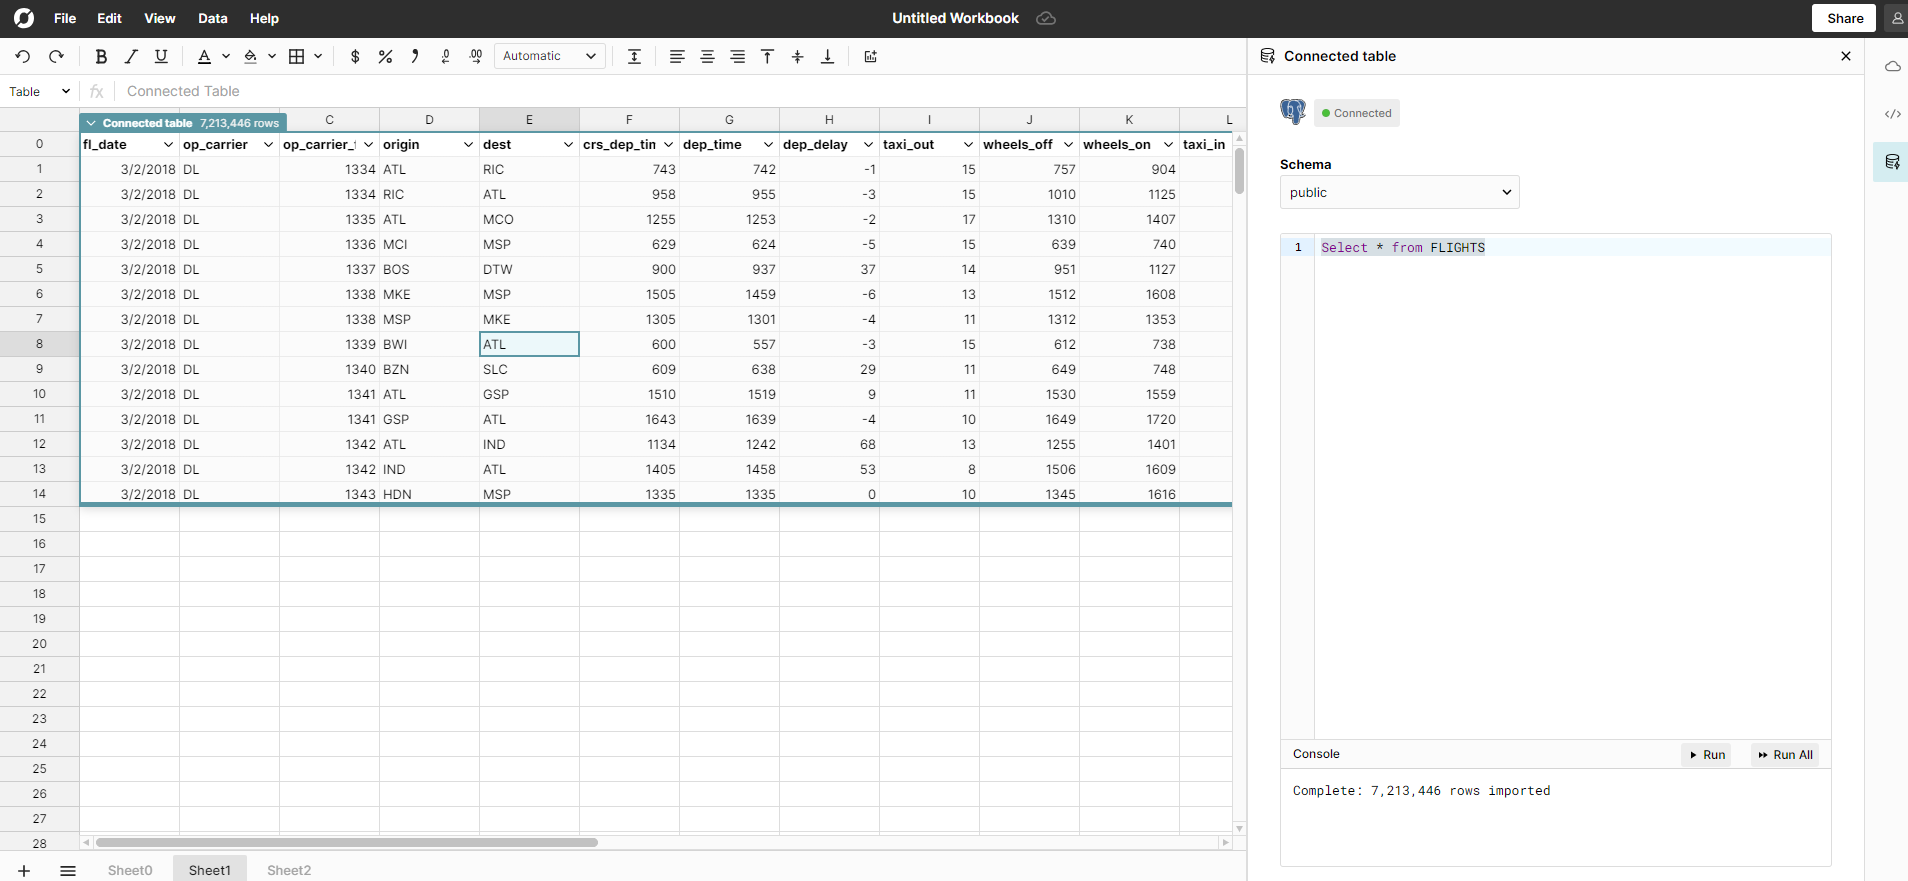
3. Begin analysis in Row Zero
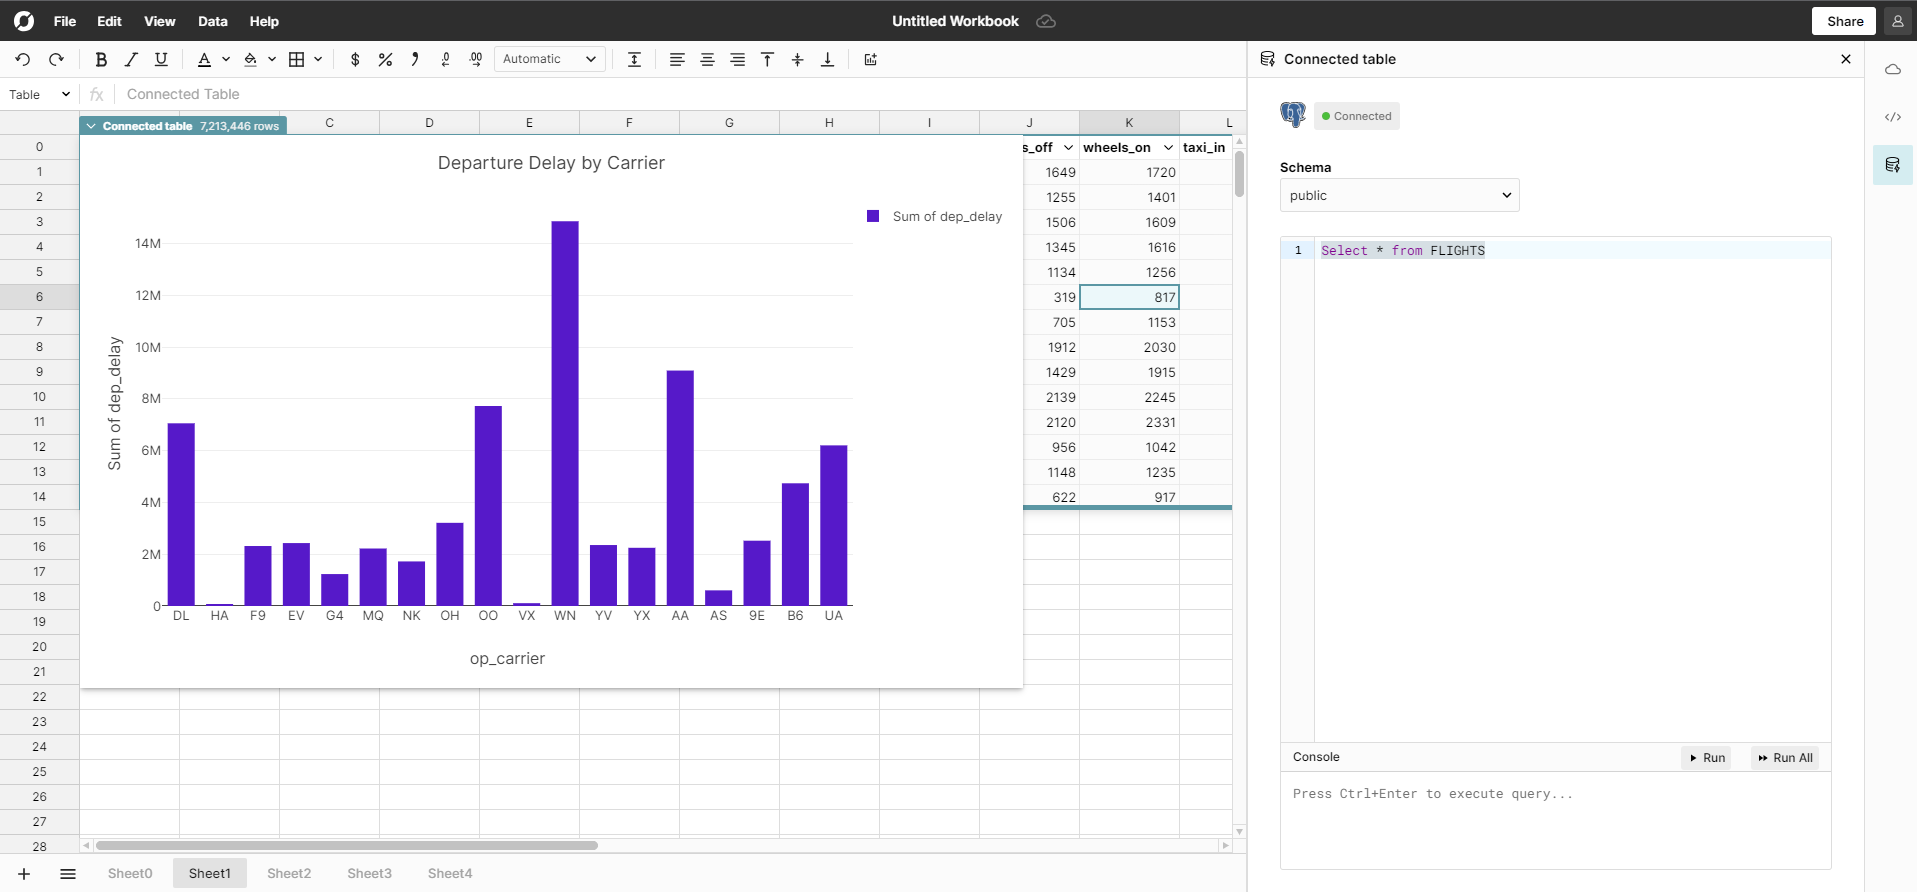
Once the data is loaded into the data table use all the features in Row Zero to analyze, filter/sort, pivot, and graph the data.
Overview
Postgres is a popular and cost effective database choice for storing data. The challenge with analyzing data stored in a Postgres database is the need to write SQL queries in order to pull data from the database into a spreadsheet. Additionally, popular spreadsheets cannot open big data sets often stored in databases. BI/dashboard tools made for big data sets are expensive and more difficult to learn. Row Zero makes it easy to analyze data by connecting to a Postgres database, importing the data directly into a blazingly fast spreadsheet, and allowing anyone to sort, filter, pivot, and graph the data. You can open your own Row Zero workbook and connect to a PostgreSQL database today.
If you use another cloud data warehouse or blob storage, Row Zero also connects to Snowflake, Databricks, Redshift, BigQuery, and S3.