Connect Databricks to Row Zero
The following post provides a brief overview of the benefits and challenges of analyzing data in Databricks and provides simple instructions for connecting Row Zero and Databricks to import and analyze big data sets. For the fastest path, watch the video below and connect your Databricks warehouse.
Contents Go straight to connection steps
- What is Databricks?
- Why is it helpful to analyze Databricks data in a spreadsheet?
- Why is it hard to analyze data stored in Databricks with a spreadsheet?
- How to analyze Databricks data in a spreadsheet
- Conclusion
What is Databricks?
Databricks is a data lakehouse, which is a data platform that combines qualities of data lakes and data warehouses. Data lakes are data repositories that allow companies to store structured and unstructured data without having to structure it first. Data warehouses are traditionally repositories for structured data, like databases, where data is organized and stored for a specific purpose. Databricks operates on a cloud-native architecture, enabling organizations to seamlessly store, manage, and analyze vast amounts of data across multiple clouds without the constraints of hardware limitations. Databricks makes it easy for companies to access all their data in one place, which has become increasingly important in supporting a variety of AI initiatives.
Why is it helpful to analyze Databricks data in a spreadsheet?
Data stored in Databricks is often only accessible to analytics and BI teams who know how to write SQL or work with BI tools. Finance, operations, marketing and other business teams people are most comfortable in spreadsheets but are often relegated to using rigid dashboards or making requests of BI teams. With Row Zero, business teams can connect directly to Databricks, import data into the spreadsheet, and perform the analysis they need. Row Zero is enabling true self-serve analytics. Below are a few example use cases:
- Live models - Build a model around a live data set. Instead of recreating that model on a weekly or monthly cadence, simply refresh the data import from the Databricks and the Row Zero workbook updates every value.
- No SQL needed - Enable business, operations, supply chain and marketing teams to access and analyze big data sets without having to learn complicated BI tools or make requests of their BI team.
- Explore and visualize - Analyze data by both viewing the individual rows, graphing, and pivoting. Drill down into the actual values to understand where anomalies exist.
- Ad-hoc analysis - Spur of the moment questions provoked by dashboards can be quickly answered with simple spreadsheet analysis without going back to the BI team.
- Collaborative decision making - Multi-user collaboration makes decision-making easier when every business partner has access to the golden data set and can share the analysis in a spreadsheet format others can easily audit and inspect.
- Join data sets - Often times an analysis requires joining two distinct data sets that may not reside in the same database. Row Zero lets users connect any number of data sources and upload csvs. Then join the data sets with join statements, VLOOKUP/XLOOKUP, or Python.
Why is it hard to analyze data stored in Databricks with a spreadsheet?
While Databricks makes it incredibly easy to store and access large amounts of data, it can be challenging to analyze data stored in Databricks using a spreadsheet for 2 reasons:
1. Dataset Size
Analyzing and processing large amounts of data is not easy and common spreadsheet applications, like Microsoft Excel and Google Sheets, slow down or crash when big data sets are imported. See blogs, Excel Row Limit and Google Sheets Row Limit for more information. Row Zero is a spreadsheet designed for big data and can process hundreds of millions of rows of data.
Due to the performance deficiencies of legacy spreadsheets, companies typically resort to paying for expensive BI and dashboard tools, like Looker, Tableau, and Power BI. These tools require a data engineer to set up and limit analysis to predefined aggregations and pivot table style analyses whereas a powerful spreadsheet, like Row Zero, gives every employee the ability to work with big data without the extra integration and training overhead.
2. Need to know SQL
Once a company stores data in Databricks, a user must write SQL queries using Databricks' Query Editor in order to access and analyze the data. Many business analysts do not know SQL, often creating a queue of requests for data teams. Businesses often try to mitigate this problem by providing BI and dashboard tools to business users. While these tools are nice for high level metrics and claim to provide self-serve analytics, they are not actually used by everyone. Business users still want to export data to a spreadsheet to perform their analysis. Row Zero lets business teams use the same spreadsheet skills they already have to interact with the company's Databricks cloud data lakehouse.
How to Analyze Databricks Data in a Spreadsheet
There are 3 steps to easily connect Databricks to Row Zero and analyze data in a spreadsheet. Follow the instructions below to get started.
- Connect Row Zero to your Databricks account
- Write a query to import data
- Begin analysis in Row Zero
1. Connect Row Zero to Databricks
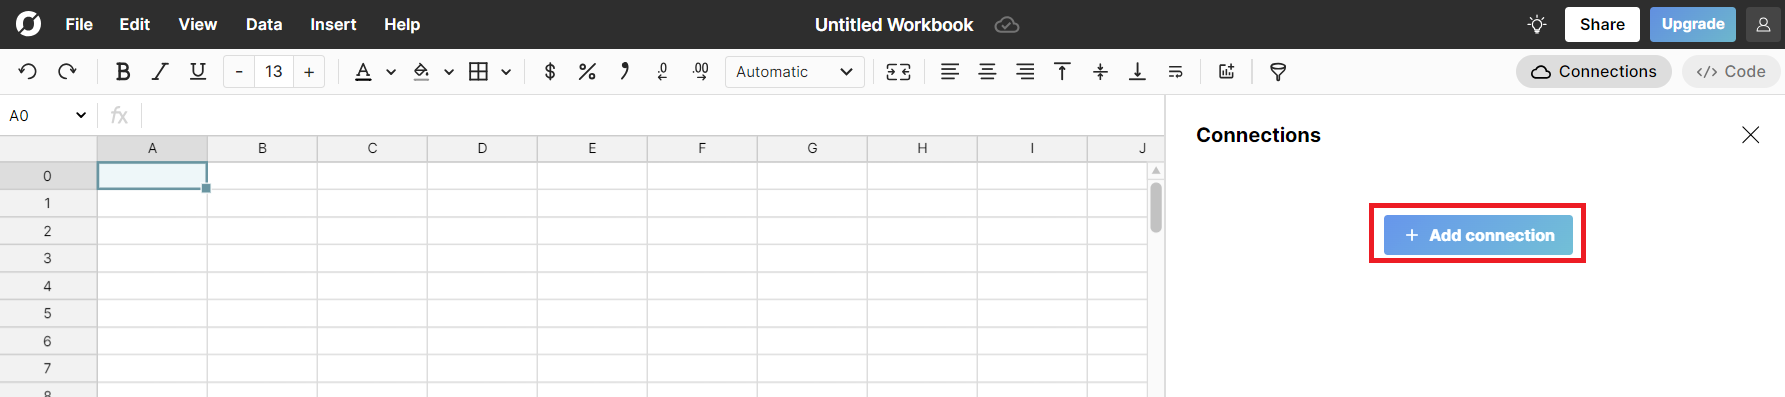
In Row Zero click on the 'data source' icon in the right-hand menu and then click the button for 'New data source.' 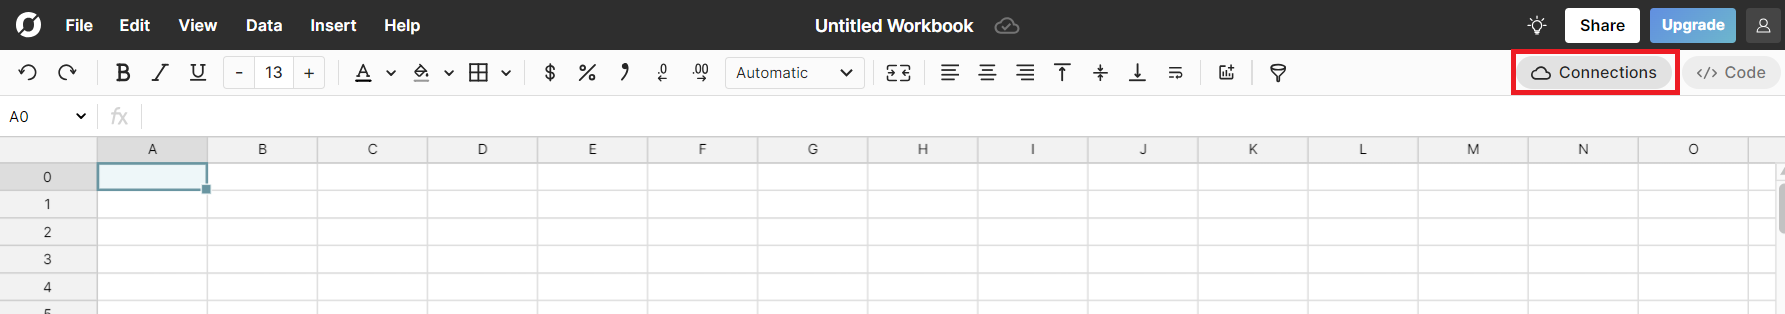
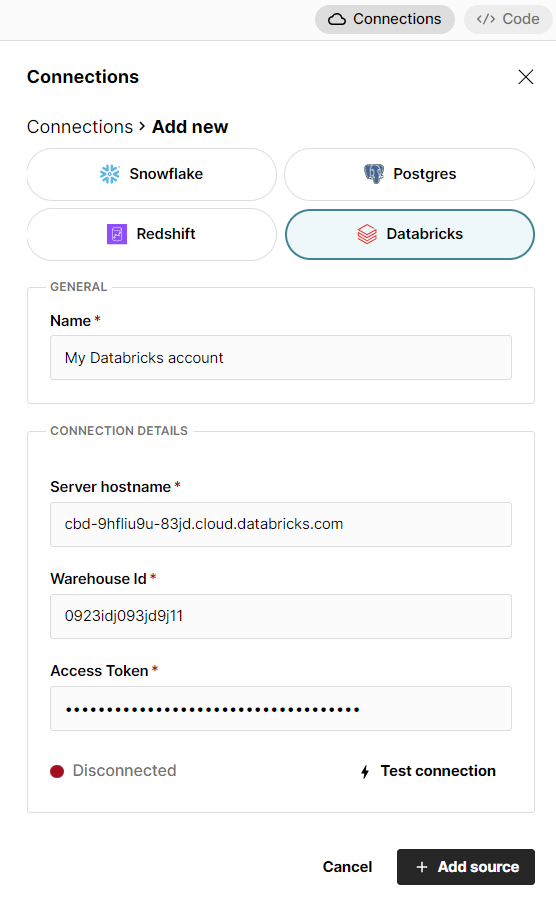
The connection requires 4 pieces of information defined below.
- Name - This field can be anything that helps identify the data source being connected. (e.g. "Production Data" or "Product Metrics")
- Server Hostname - This is the Databricks warehouse name, which can be found in your Databricks portal under the SQL Warehouses menu. In SQL Warehouses, click on the warehouse you wish to connect to. Your server hostname is listed under Connection details and is the long string of letters and numbers under "server hostname" at the top of the screen (e.g. cbd-9hfliu9u-83jd.cloud.databricks.com).
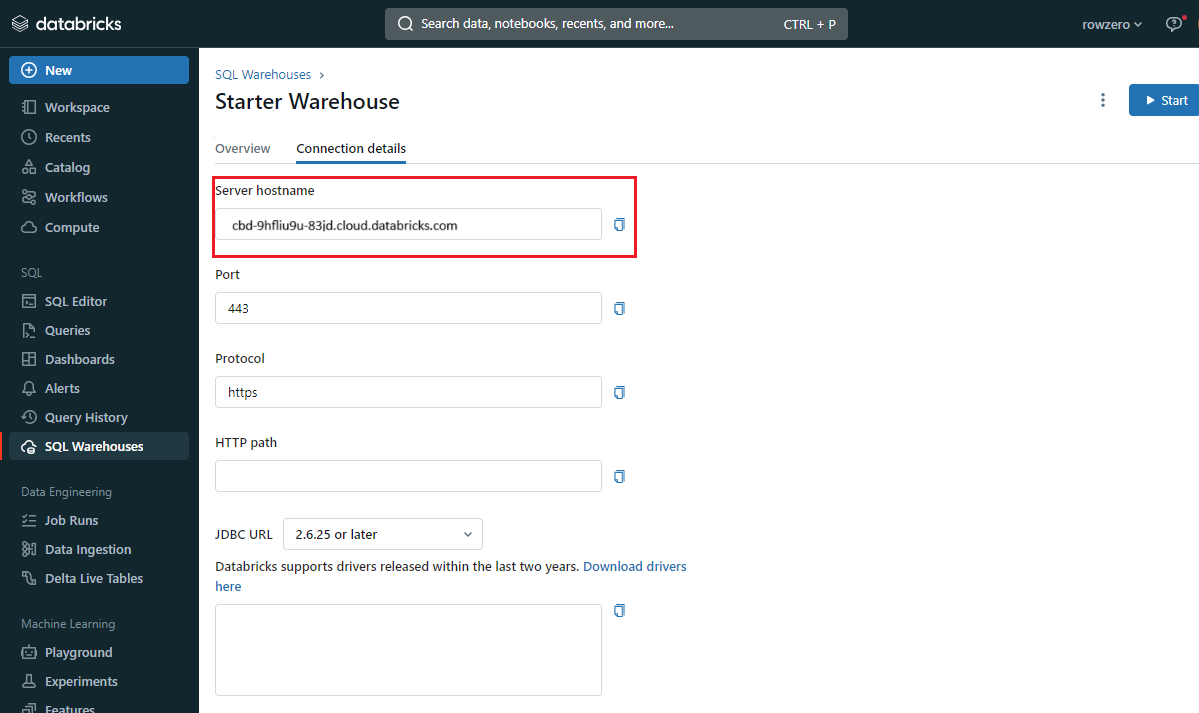
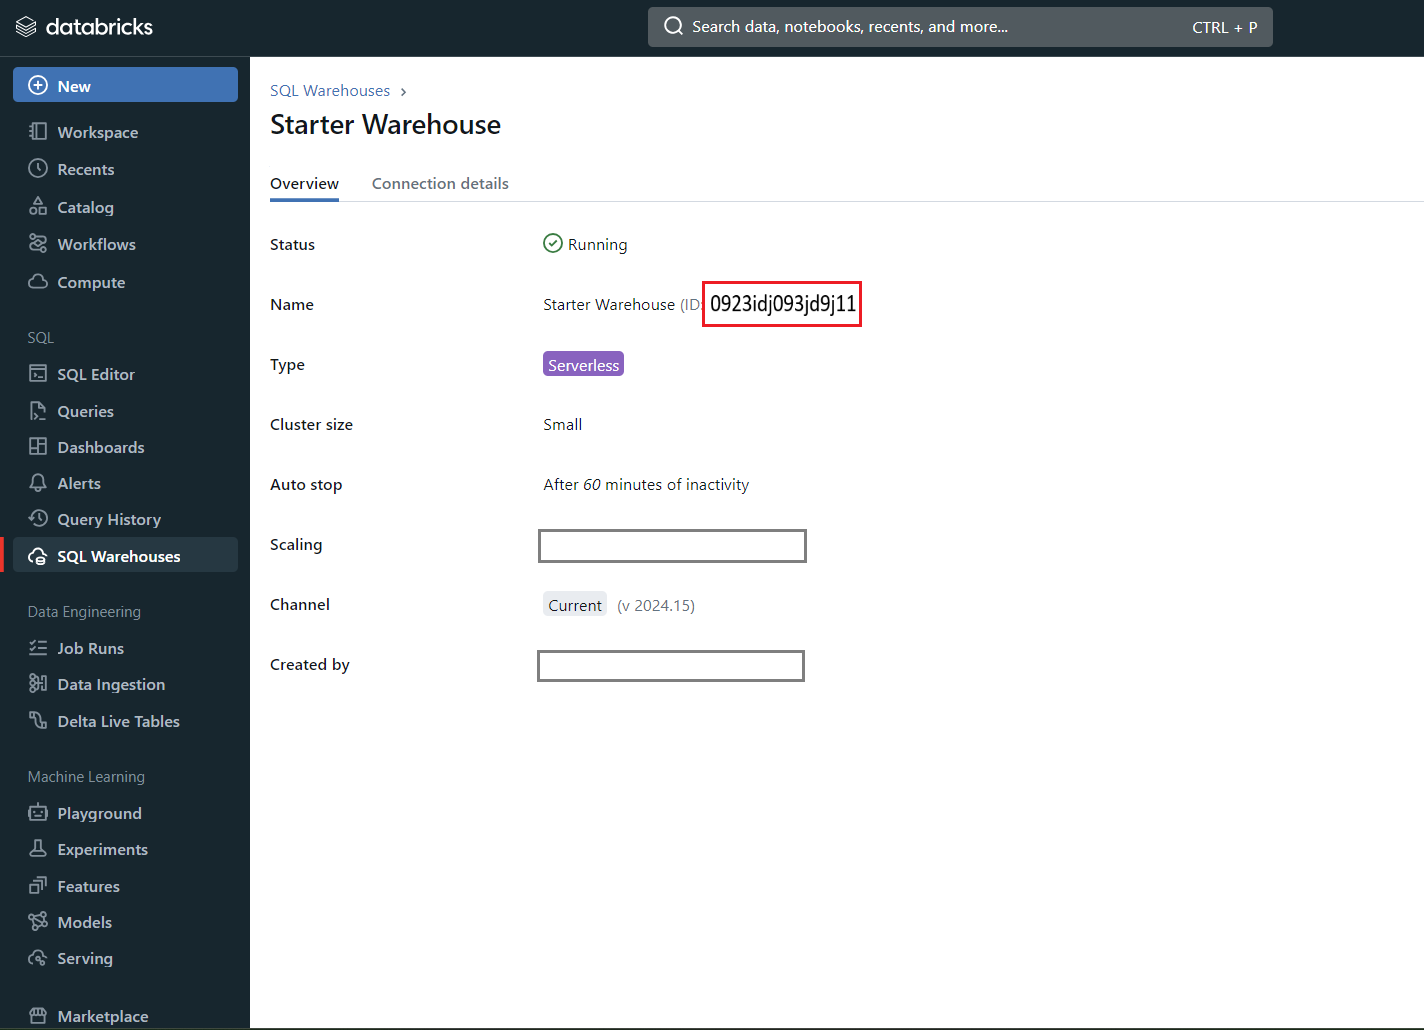
- Warehouse ID - Warehouse ID is under the SQL Warehouses > Overview > Name (e.g. 0923idj093jd9j11)
- Access Token - Your access token can be generated by going to your account icon in the upper right-hand corner of the Databricks portal, selecting "Settings" and then "Developer." Click the blue button to generate your access token. If you do not see a blue button, contact your Databricks account admin as they will need to update your Databricks personal access token permissions.

Once all the information is entered, hit 'Test connection' to ensure the information is correct. If the test returns green, you can select "+ Add source" to add the data source. Once added and connected, you will be asked to select the 'Catalog' and 'Schema.' 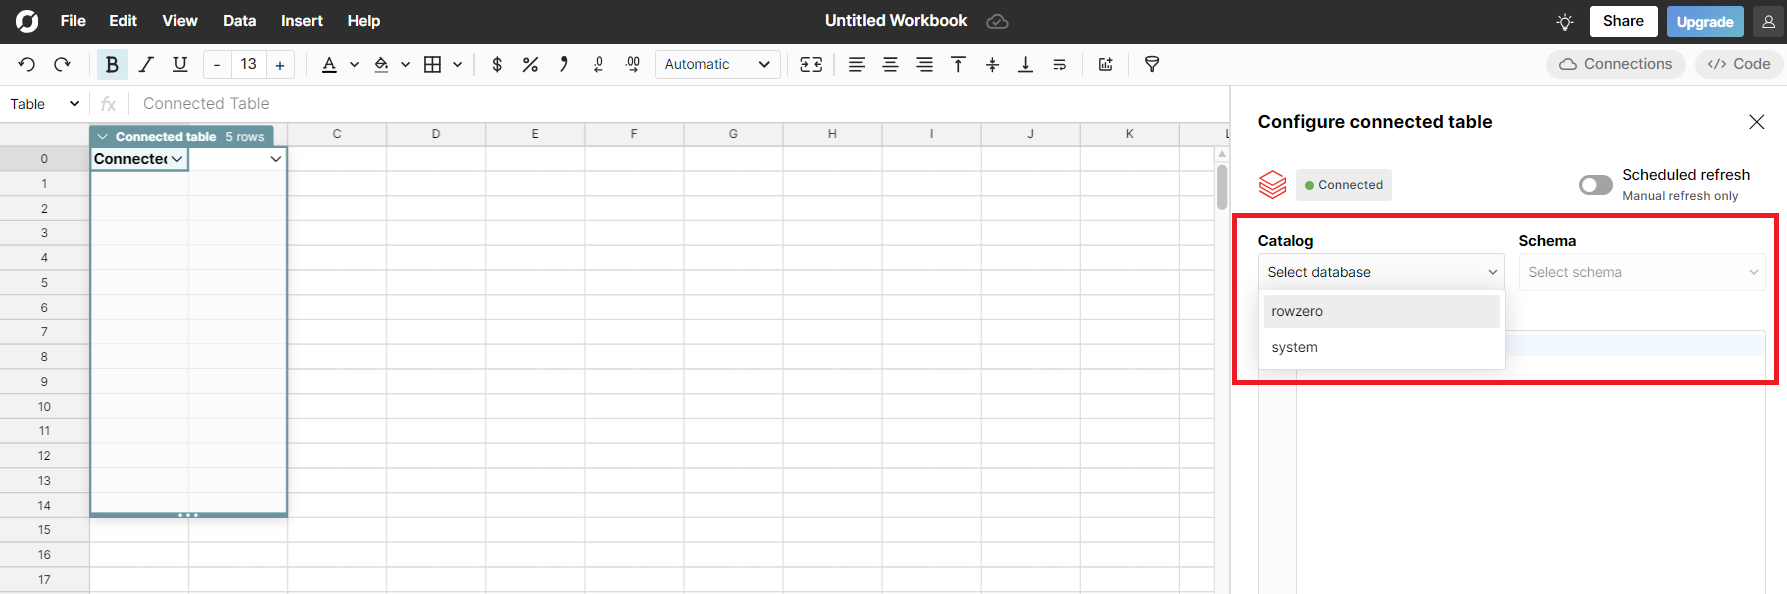
2. Write a query to import data
Now that Databricks is connected to Row Zero, begin writing a query to pull data into the spreadsheet. First select the 'Database' and 'Schema' from the two drop downs. Write a query in the query editor. The easiest query to write is the 'select *' statement, which pulls in the entire table. Example:
select * from TABLENAME
Row Zero is equipped to handle large data sets and will easily ingest the entirety of a database. Write more complicated queries to pull in various subsets of data stored in Databricks. All results will be displayed in the 'connected data table' in the spreadsheet. 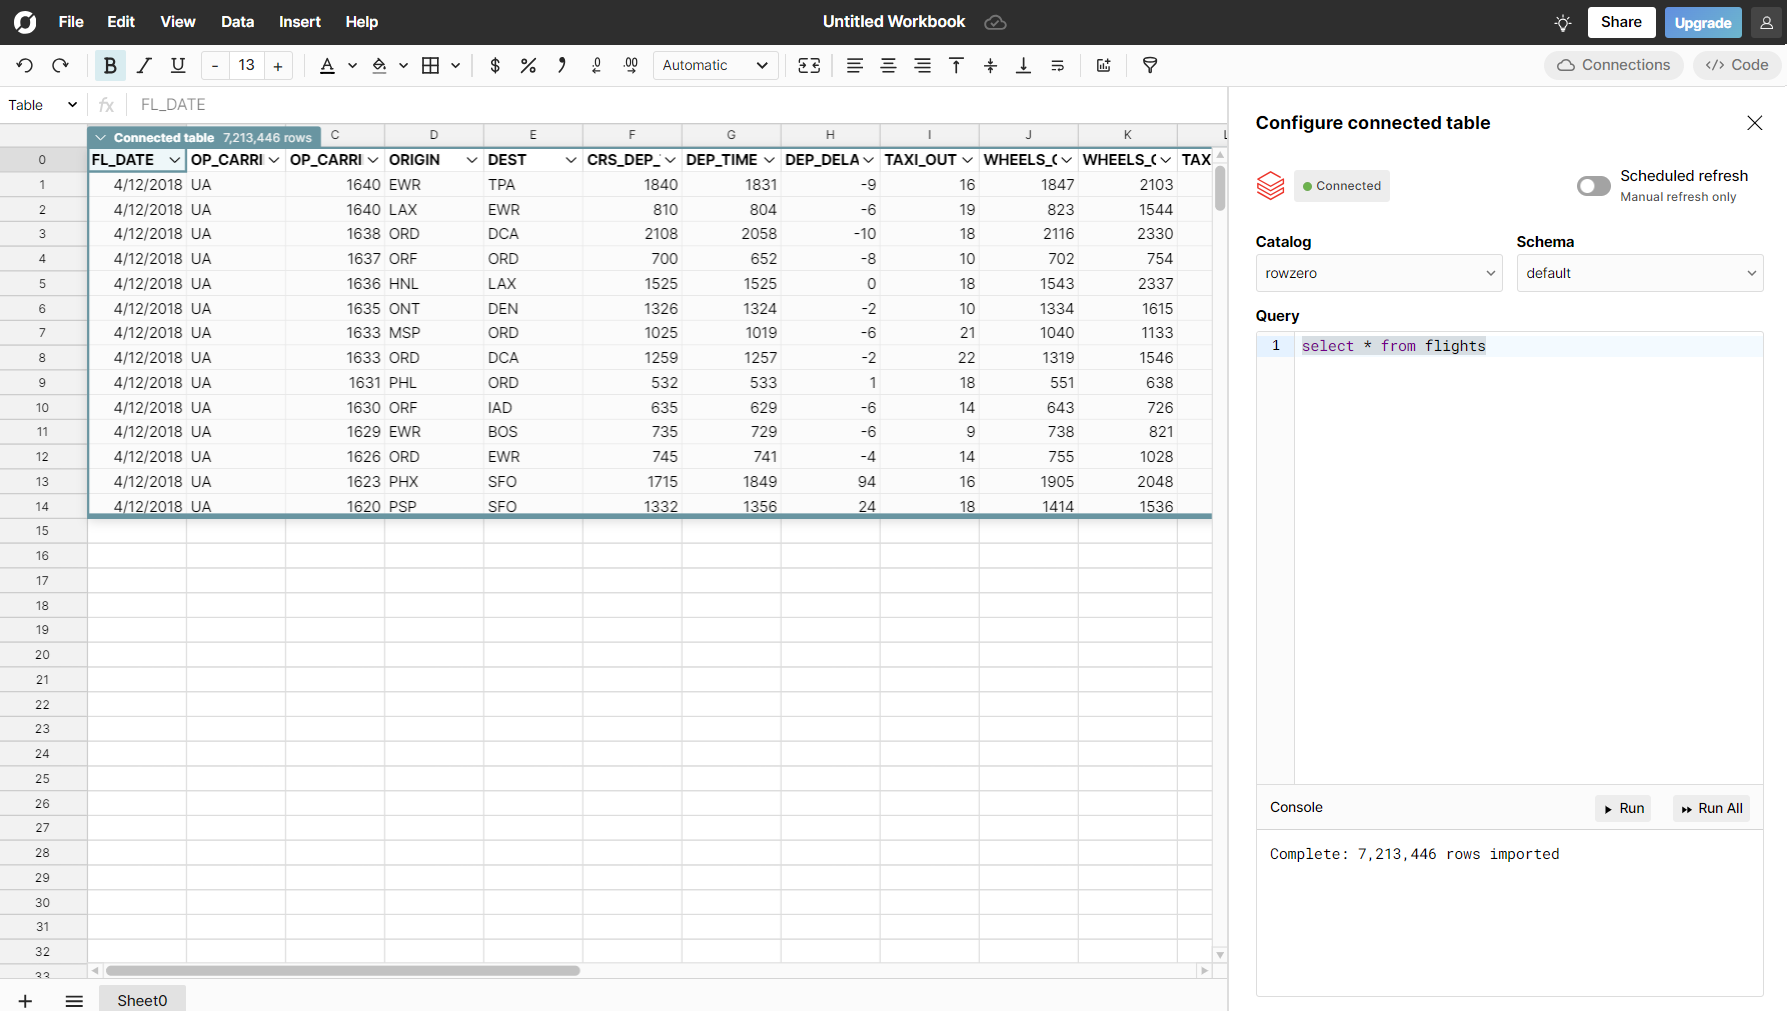
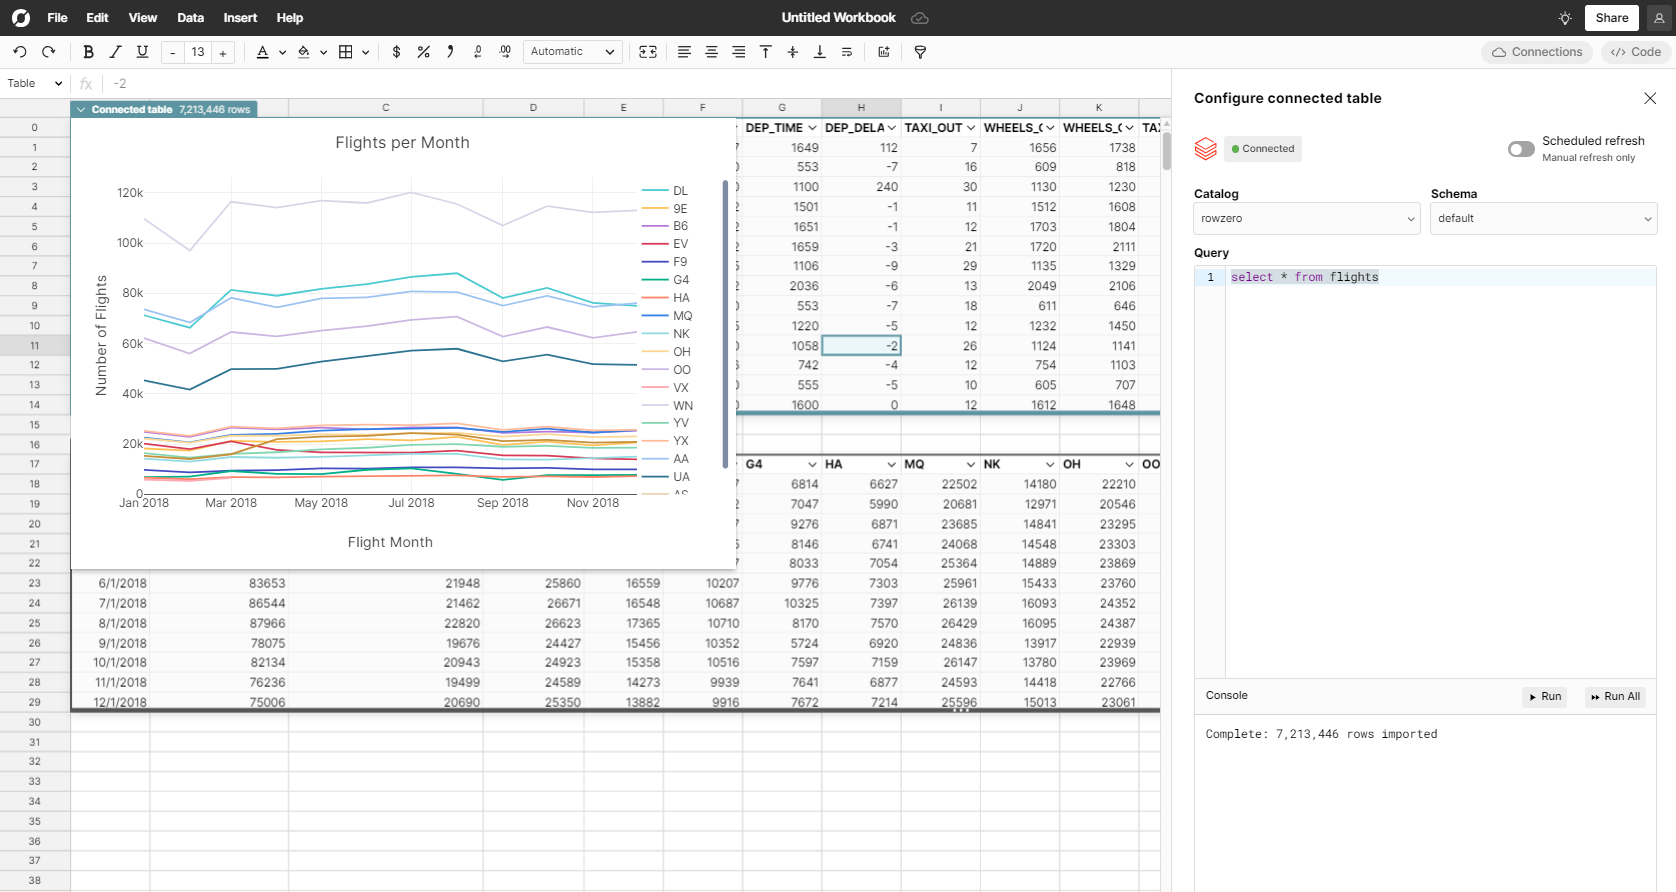
3. Begin analysis in Row Zero
Once the data is loaded into the data table use all the features in Row Zero to analyze, filter/sort, pivot, and graph the data.
Conclusion
Databricks is a popular data intelligence platform for storing and accessing large amounts of data. The challenge with analyzing data stored in Databricks is traditional spreadsheets cannot open the big data sets and BI/dashboard tools are expensive and more difficult to learn. Row Zero makes it easy to analyze data stored in Databricks by connecting to a company's Databricks lakehouse, importing the data directly into a Row Zero spreadsheet, and enabling anyone to sort, filter, pivot, and graph the data. You can open your own Row Zero workbook and connect to Databricks today..
If you use another cloud data warehouse or blob storage, Row Zero also connects to Snowflake, Postgres, Redshift, and S3.